Software

Learn more

NHS COVID-19 app statistics
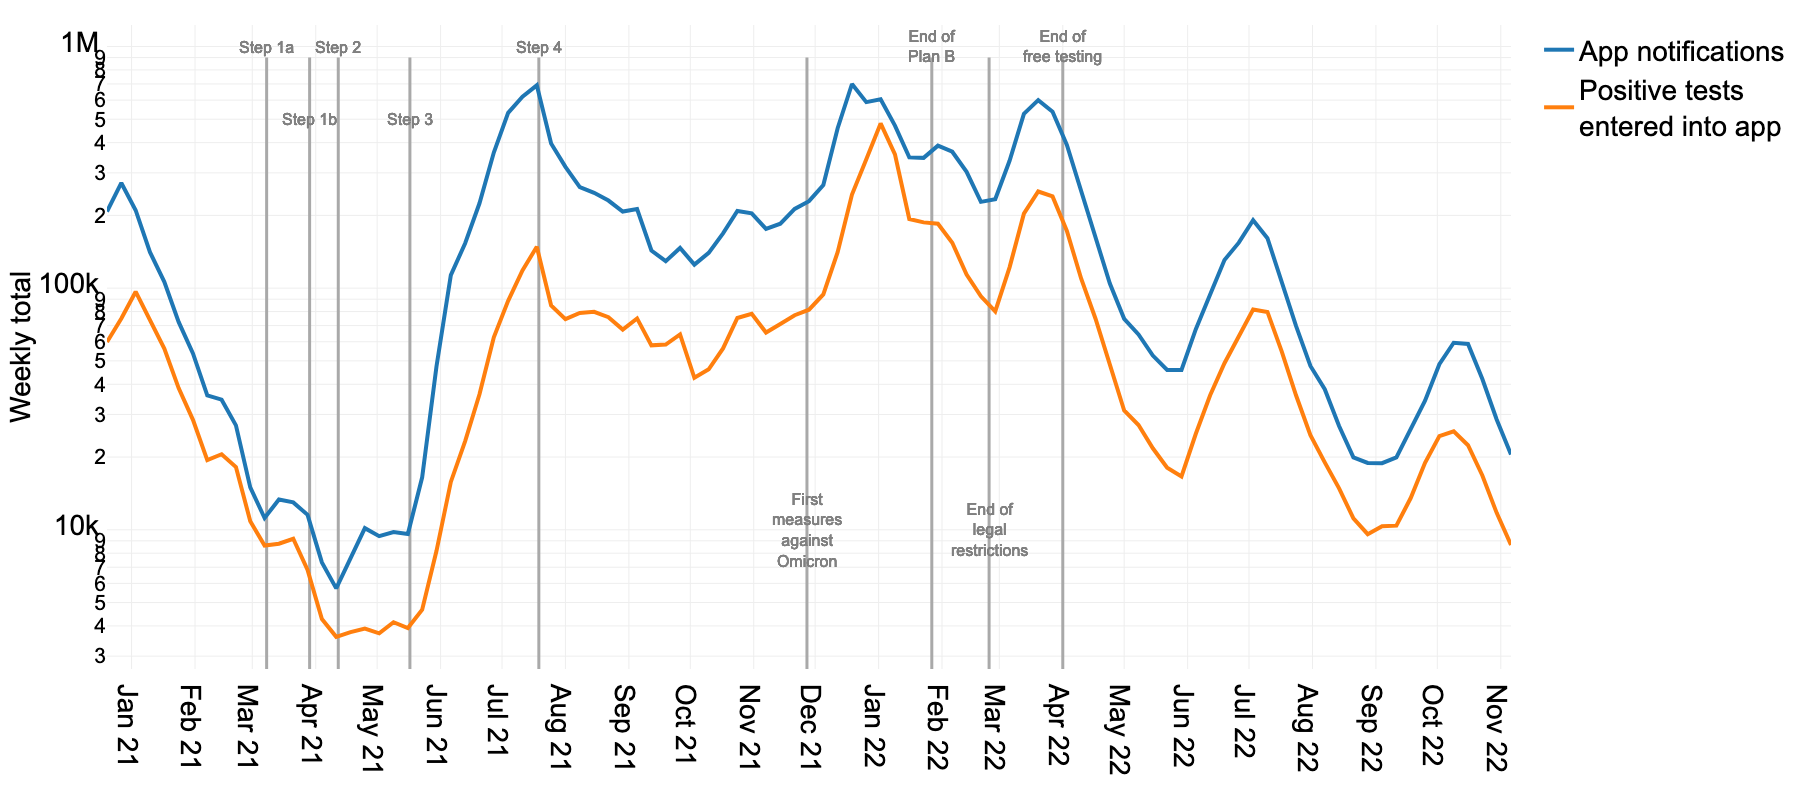
This dashboard presents public data from the NHS COVID-19 app and UKHSA dashboard data to help understand the performance of the NHS COVID-19 app for England and Wales. Updated every other Thursday, in line with the app data.

Image from dashboard showing app notifications and positive tests

Local Covid Tracker

This shiny dashboard was built to track local COVID-19 infection levels across England and Wales. The methods used were based on those described in this paper. It was retired in July 2022. You can still run it directly from an R installation using this GitHub code.

track local infection levels in England and Wales

COVID-19 transmission routes

We analysed the routes of infection of COVID-19 and showed that a high proportion of infections come from pre-symptomatic and asymptomatic individuals. This means that contact tracing needs to be fast and scalable to be an effective intervention towards controlling the epidemic.

This shiny app enables you to explore our results and test their sensitivity to our modelling assumptions.

lowering the growth rate with interventions

Me

treespace is an R package for the exploration of landscapes of phylogenetic trees.

It is also available as a user-friendly Shiny app which can be launched via the R package or directly from your browser.

treespace example

phyloTop

phyloTop is an R package which provides tools for calculating and viewing topological properties of phylogenetic trees

phyloTop example

GitHub

I also contribute to various projects over on GitHub - you can see the latest repositories I'm working on here.

GitHub