Anonymised data from the NHS COVID-19 contact tracing app provided rich insights into the drivers of the epidemic, at remarkable speed.
The NHS COVID-19 app for England and Wales was launched in September 2020 to alert users when they had been exposed to COVID-19. By performing contact tracing quickly, anonymously and on a large scale, the alerts advised users to take precautions early enough to help limit the spread. We have previously analysed the app’s effectiveness: early results in 2021 showed that during its first three months the app’s contact tracing functionality reduced the total number of cases by several hundred thousand. Later analysis showed that in its first year the app averted around 1 million cases, corresponding to 44,000 hospital cases and 9,600 deaths.
Our results were approximate because the app was privacy-preserving by design and collected only minimal data to ensure it was functioning correctly. Nevertheless, the large number of users (18 million at its peak in summer 2021) and the length of its operation until April 2023 created a large data set which enabled us to gain some unexpectedly detailed insights. In December 2023 we published an analysis that quantified the roles of duration and proximity between contacts for the risk of transmitting COVID-19, based on the app’s Bluetooth signal measurements.
Our latest paper, “Drivers of epidemic dynamics in real time from daily digital COVID-19 measurements”, published today in Science, describes new epidemiological insights gleaned from the app. The data revealed some important details about the drivers and dynamics of transmission which have never been measured on such a scale or in real time before. Some of these insights were used during the pandemic to inform decision-making in the UK. This potential for gathering insights forms a secondary benefit of digital contact tracing technologies, complementary to their primary purpose of reducing spread, which should further motivate their development and deployment for future epidemics.
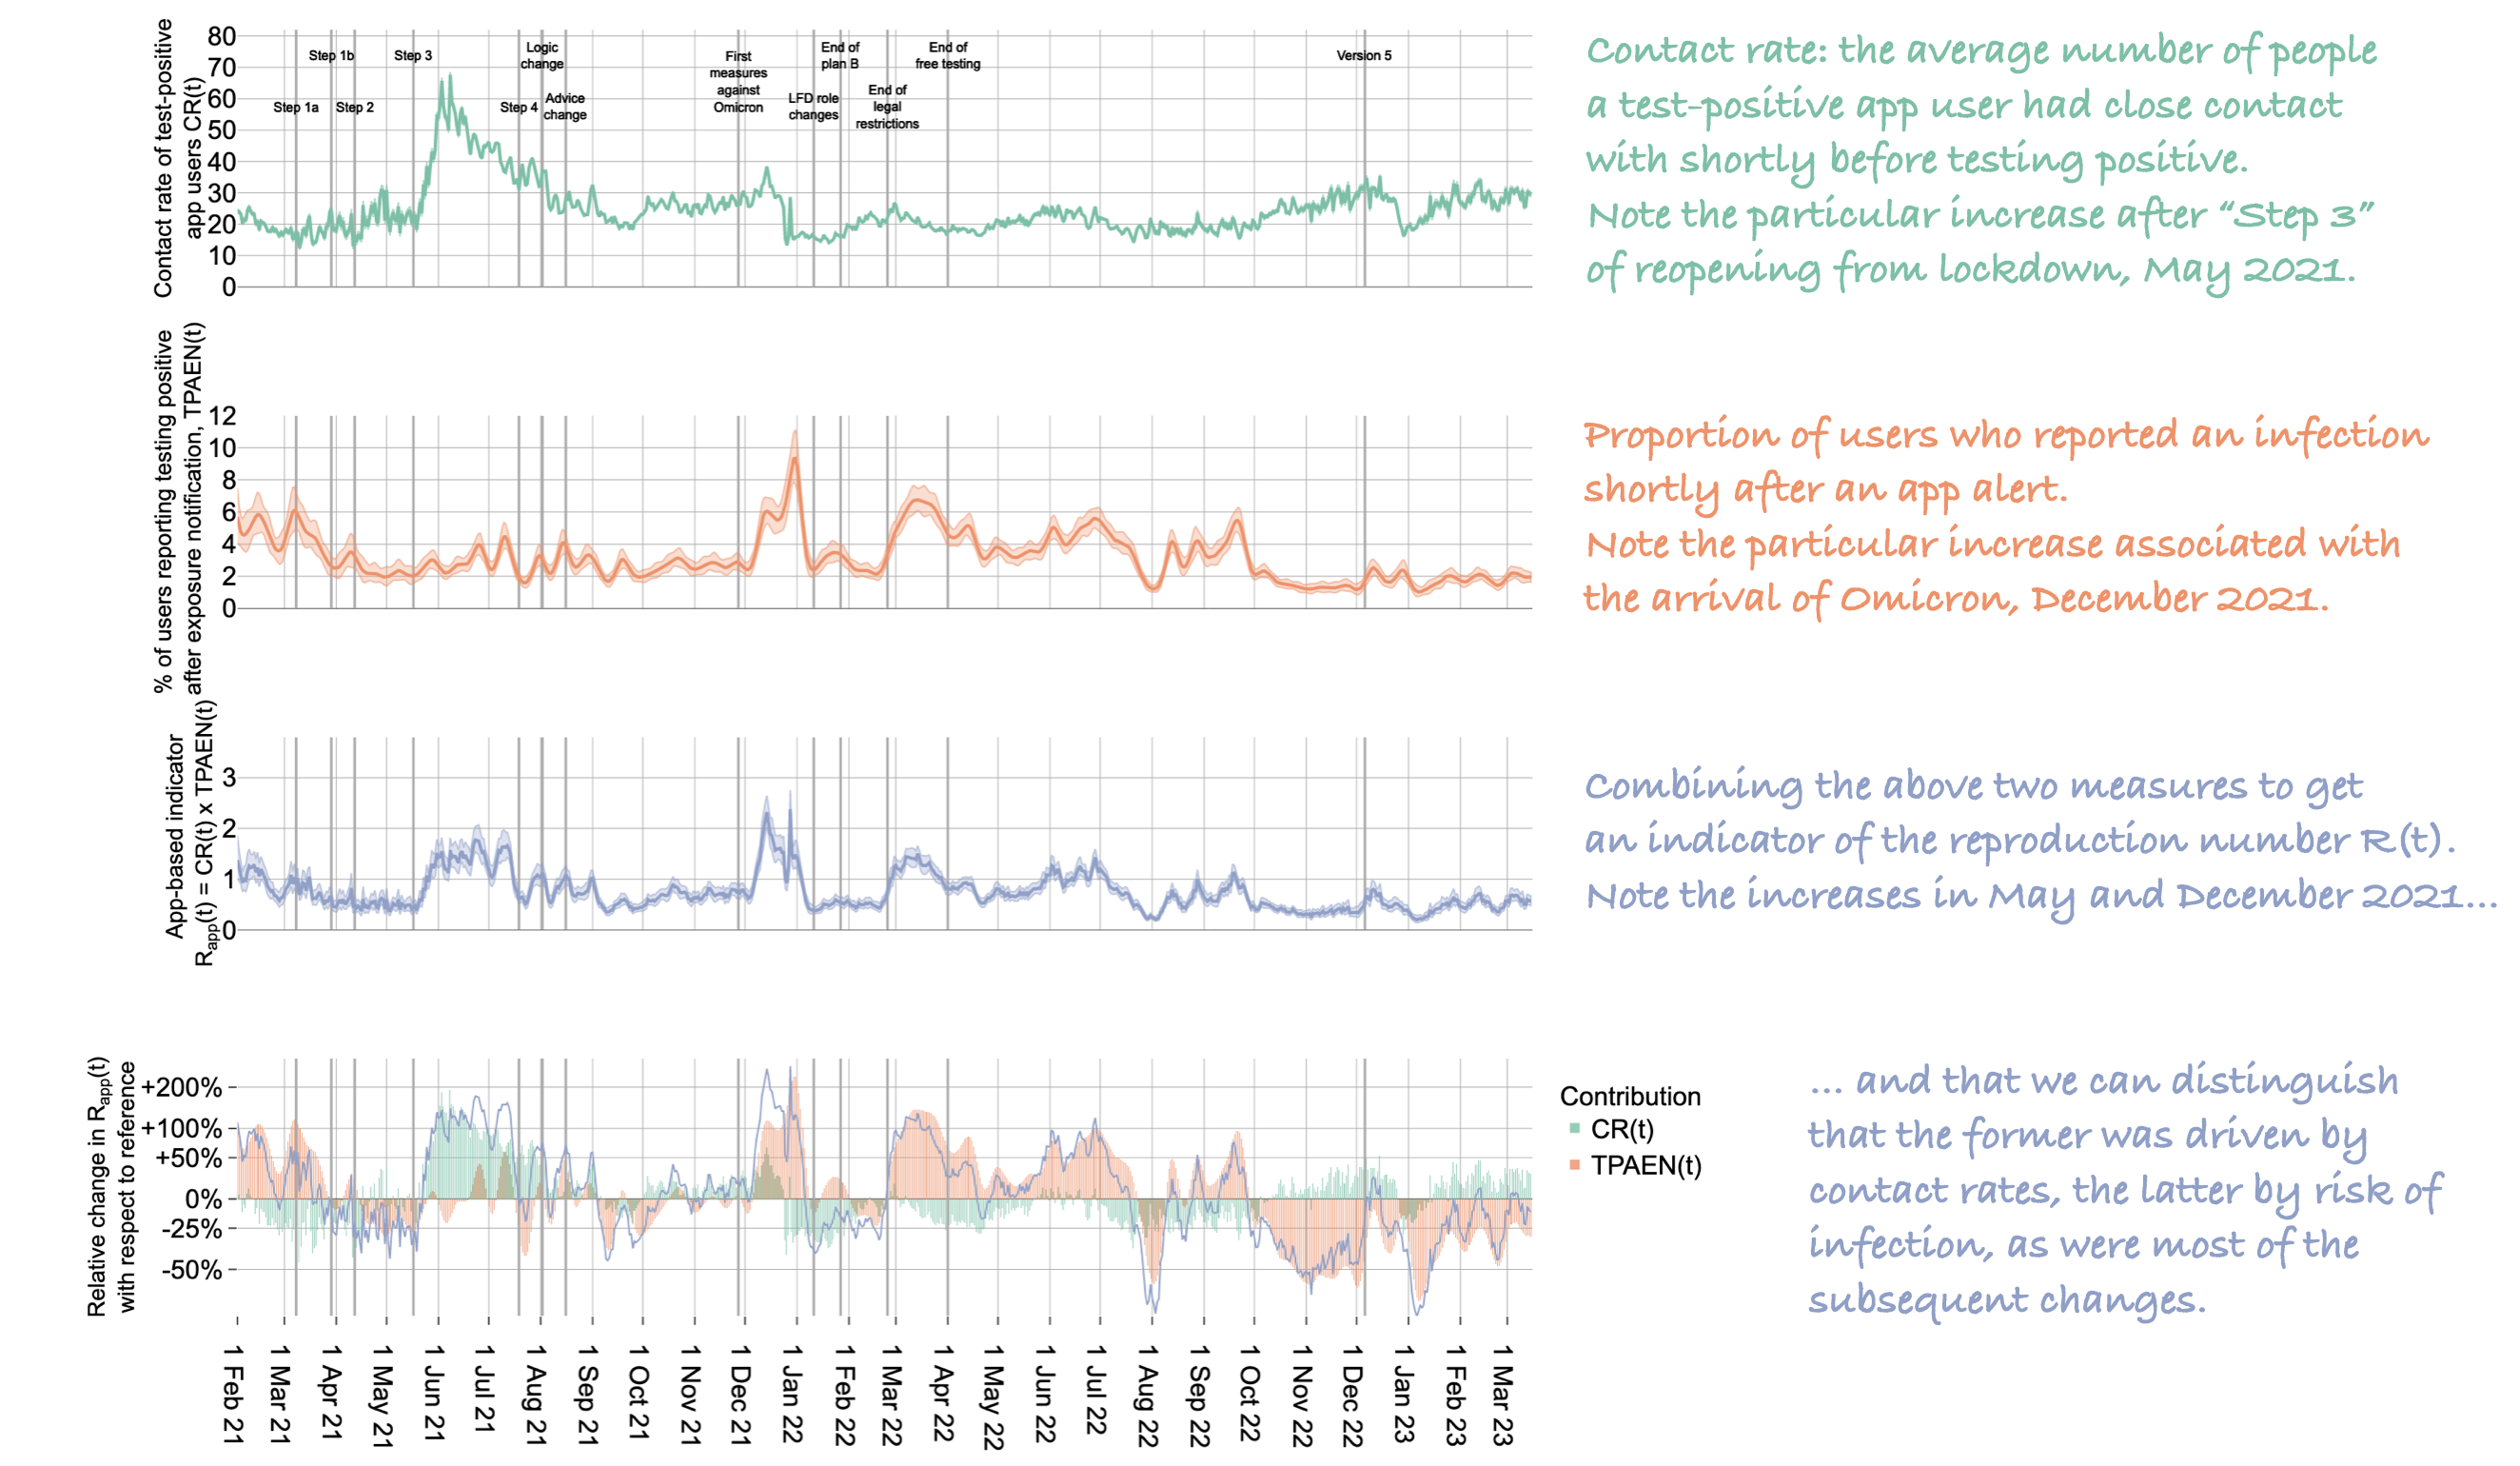
Our first set of results describe insights about the extent to which people were meeting up and how ‘risky’ their contact patterns were. Together, these measures were used to recreate a version of the reproduction number R(t). That is, the daily numbers of positive tests and notifications provided a measure of how many contacts people were having, on average. As expected, this was low during lockdowns and higher as restrictions eased. Various other surveys and data streams collected similar signals during the epidemic, but the app data had some unique qualities: it was available the very next day, and it was specifically measuring the contact patterns of people who had just tested positive for COVID-19, not the whole population. This was likely to be relevant during the initial vaccination roll-out of early 2021, which was largely organised by age in the UK, meaning that COVID infections were concentrated into specific unvaccinated age groups at certain times.
A few days after users were alerted, we could check to see on a national level what proportion of them had gone on to register testing positive themselves. This was one way of measuring the accuracy of the app — see here for more details. Using these measures together (with some re-weighting of the data to mimic population-level dynamics), we had a measure of the average number of contacts a test-positive user was infecting at each stage of the epidemic, that is, a measure of the reproduction number R(t). Although this measure had some limitations, it consistently tracked other measures of R(t), with three key benefits:
- it was available at least five days earlier than other measures;
- it was particularly good at detecting sudden increases in R(t)—moments when the epidemic was suddenly growing—which is important for decision making;
- each change in R(t) could be immediately attributed to changes in contact patterns, the probability of reported infection, or both. That is, we could quantify the extent to which a change was driven by population dynamics (how much people were meeting up) and/or by viral dynamics (new variants, vaccines, etc.). In particular, we found that changes in contact rates were the main drivers of changes in R(t) through most of 2021, whereas after the arrival of the Omicron variant the main driver was the risk of infection per contact.
Since the app was a new technology in 2020, we were unsure how reliable the daily signals from its data would be against a background of changing user numbers, changing testing policies, availability of tests, and so on. Looking back over the data and comparing our measures to those from other sources, the app data proved to be reliable. This motivates the use of similar technologies for low cost, near-real-time monitoring of future epidemics.
Below is a Figure from the paper, annotated with explanations down the right hand side. It shows insights from app data from February 2021 to March 2023, with some key moments of policy change annotated along the timeline.
Our second set of results show how—particularly at times of peak use—the app data provided fine-grained insights into the variations in epidemic drivers by region, day of the week, setting (longer versus fleeting contacts), public holidays and events. In particular we looked in detail at the effects of Christmas holidays and the Euro 2020 tournament (held in 2021). Some highlights revealed by the app data were:
- Regional differences included that London generally had a similar R rate to the rest of England and Wales, but comprised of higher contact rates and lower risk of infection per contact—see Figure 3 in the paper.
- Day-of-the-week differences included that transmissions peaked almost every week on Saturdays—see Figure 4B.
- Setting differences included that ‘household contacts’ (approximately classified as those for more than 8 hours in a day; the app recorded no data about where exposures occurred) accounted for only 6% of contacts but 39% of transmission events, whereas fleeting interactions (less than 30 minutes) accounted for 48% of contacts but only 12% of transmission events. Household transmissions were highest on Sundays, whereas fleeting transmissions peaked on Saturdays—see Figures 5 and 6.
- Christmas periods saw key shifts in population dynamics, breaking the usual day-of-the-week patterns. The limited number of contacts on Christmas Day and shortly afterwards resembled a self-imposed lockdown, but the riskiness of those contacts—long days spent indoors together—created a local peak in transmissions associated with Christmas Day 2021—see Figures 6 and 7.
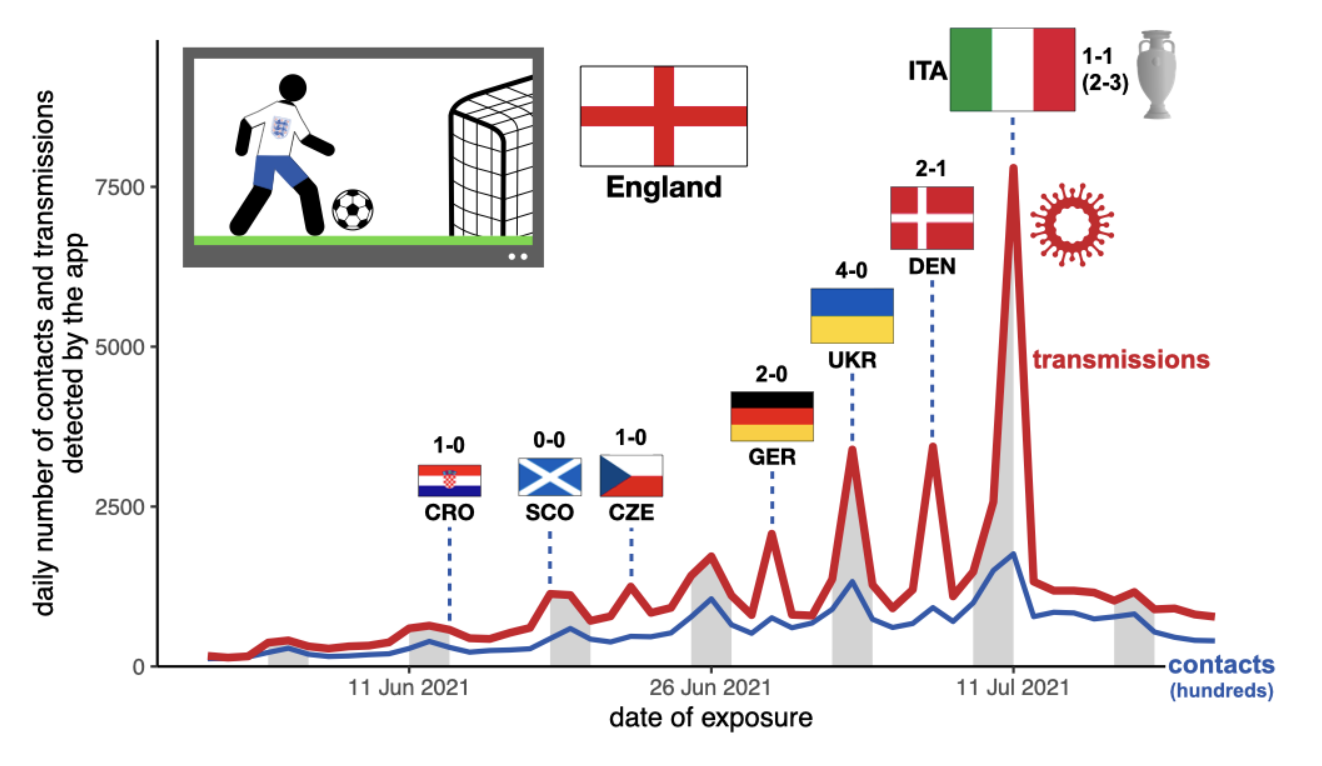
- The Euros (June-July 2021) were associated with large peaks in transmissions. Separating the data from app users in England from those in Wales, we could see that peaks in transmissions were associated with the individual national teams’ games, concentrated most of all on the 11 July 2021 when England played Italy in the final, when transmissions were between 6 and 9 times higher than expected. Overall, the excess of transmissions on match days accounted for 29% of all transmissions during the tournament. Figure 8 in the paper has the full details. The figure below shows contacts and transmissions associated with app users from England, with the dates of the England teams’ matches annotated. Weekends are shown shaded grey. We note that since Euro matches in 2021 were played in football stadiums all across Europe, peaks in transmission on match days can be attributed mostly to social gatherings in homes and pubs, rather than to supporters at the stadium.
Our results are retrospective and would not necessarily translate directly to future epidemics. For example, our finding that transmissions peaked most weeks on Saturdays may not be true for a different pathogen and/or a different population. The huge peak in transmissions associated with the Euros would have been particular to the timing of the event: the re-opening from an earlier lockdown, the stage of vaccine roll-out, the arrival of the Delta variant, etc., such that future sporting tournaments for future pathogens may not see similar transmission dynamics. Nevertheless, our results are useful for historic understanding of the drivers of the COVID-19 pandemic in England and Wales.
Further, our results show that privacy-preserving digital contact tracing technologies can provide rich insights into epidemic dynamics with unprecedented time resolution, beyond their primary purpose of reducing transmission. When decisions must be taken quickly, evidence must be available quickly, and digital technologies like the NHS COVID-19 app have strong potential to support this real-time aspect of public health. Daily data and analysis from digital contact tracing could be embedded into the epidemiological infrastructure to support future epidemic monitoring, analysis and rapid response.