The NHS Test and Trace programme was rolled out in May 2020, first on the Isle of Wight (5th) and then across England (18-28th). We looked to see whether there were any changes in the course of the epidemic which could be attributable to the Test and Trace programme, and whether there was any difference in the programme’s effect on the Isle of Wight, where it also included version 1 of the NHS contact tracing app. Here we provide a brief summary of our findings; the full details are now published in The Lancet Digital Health.
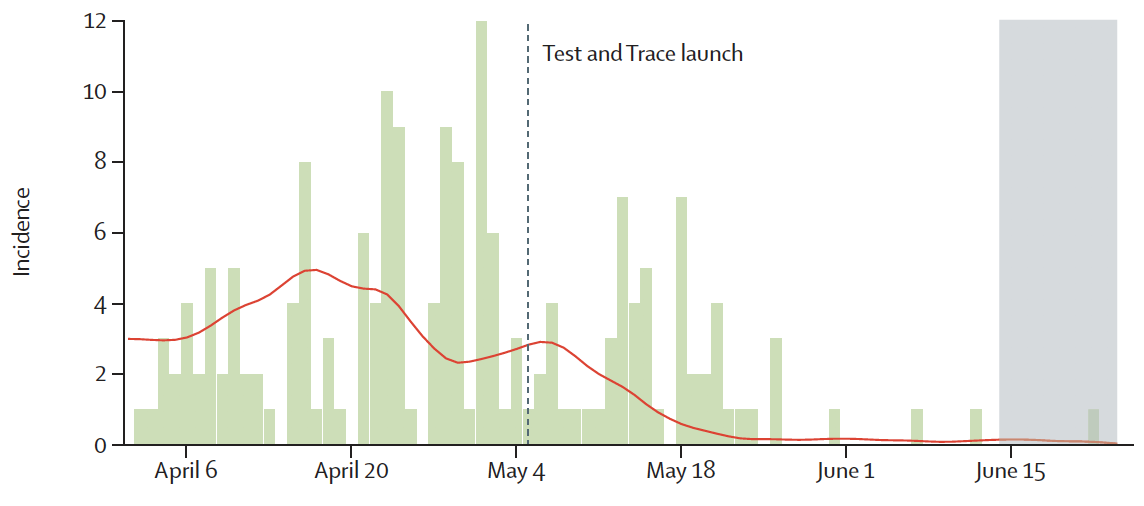
Using Public Health England’s daily “case counts” (positive swabs) we developed a method to estimate the number of new infections per day - there is a lag because people rarely get swabbed the day they are infected. The graph below shows Pillar 1 (hospital) case counts on the Isle of Wight in green, and our estimated number of new infections per day in red. We see that new infections were decreasing from mid-April. There was a slight increase at the end of April which might be an artefact of increased testing from 5th May, but then there was a noticeable decrease in infections despite the increased testing shortly after the Test and Trace launch.
Similarly, the reproduction number R - the average number of further infections each infected individual causes - decreased rapidly on the island following the Test and Trace launch. These early results support the idea that the Test and Trace programme helped to bring the epidemic under control on the Isle of Wight.
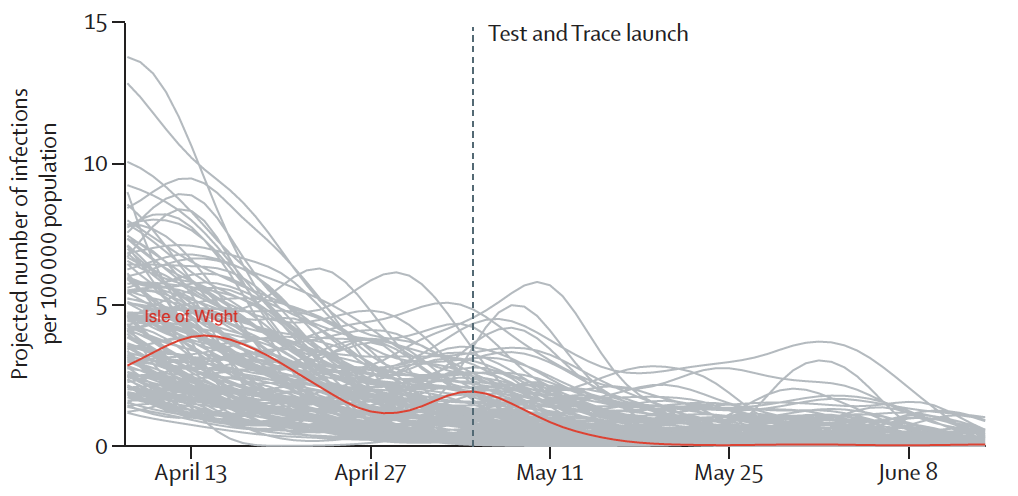
But how did the Isle of Wight’s epidemic compare to those in other areas? We used a variety of methods which all led to the same conclusion: something quite different happened on the Isle of Wight. The incidence and R rate dropped more rapidly than in other areas over comparable time periods. The graph below is a “nowcast” of the expected number of new hospital cases in the near future. The island had quite a large epidemic in mid-April, positioned “middle of the pack” when compared with other areas until May; by June-July it led the way with case counts down to less than one a week, even when we included Pillar 2 (community) cases. Using another method we found that in March-May the Isle of Wight was ranked amongst the worst R rates in England (147th out of 150) but by mid-June it was positioned 12th best.
The success on the Isle of Wight is striking, and the course of its epidemic was different from other areas - a statistically significant difference. To establish that the Test and Trace programme was the cause of the success would require ruling out all other possible causes, for which we would need more than the publicly available data. The island’s epidemic control certainly warrants further investigation because it might translate to other local and national strategies.
If Test and Trace did have an impact we will also need to disentangle which aspects had the greatest effect. Was it the huge advertising campaign at the launch? Did people self-isolate more carefully after a positive test result? Was the contact tracing programme getting ahead of the virus, advising people to quarantine before they infected others? And if so, was that primarily human contact tracing or via the app? A key piece of the puzzle would be: of the people who tested positive, how many were already self-isolating because they had been contact-traced? We hope that more data will soon be made available so that we can answer these important questions.
We have made our analyses available in LocalCovidTracker where you can explore them in more detail, and see our ongoing tracker which updates daily. It enables you to view the epidemic trend in individual local authorities in England and Wales to identify outbreaks and see the effects of interventions like local lockdowns.
![]()
This blog post also appears on the Fraser group website.