12-minute read
In the first week of March 2020, as COVID-19 cases rose dramatically around the world, researchers in Professor Christophe Fraser’s group at the University of Oxford realised that we needed to take contact tracing digital. A lot of maths, coding, discussion, write-ups (and very little sleep) followed, and by 7th March, the UK government was mobilising a team to start building the first Bluetooth proximity sensing Digital Contact Tracing app.
Six years on, I’m taking a moment to reflect on the journey so far, and what’s still to do.
Origins
The idea was firmly rooted in epidemiology. Early data from China, Singapore and the Diamond Princess cruise ship indicated that around half of all COVID-19 infections were from people without symptoms. That includes those who were ‘pre-symptomatic’, who would go on to develop symptoms, and those who remained asymptomatic throughout their infection.
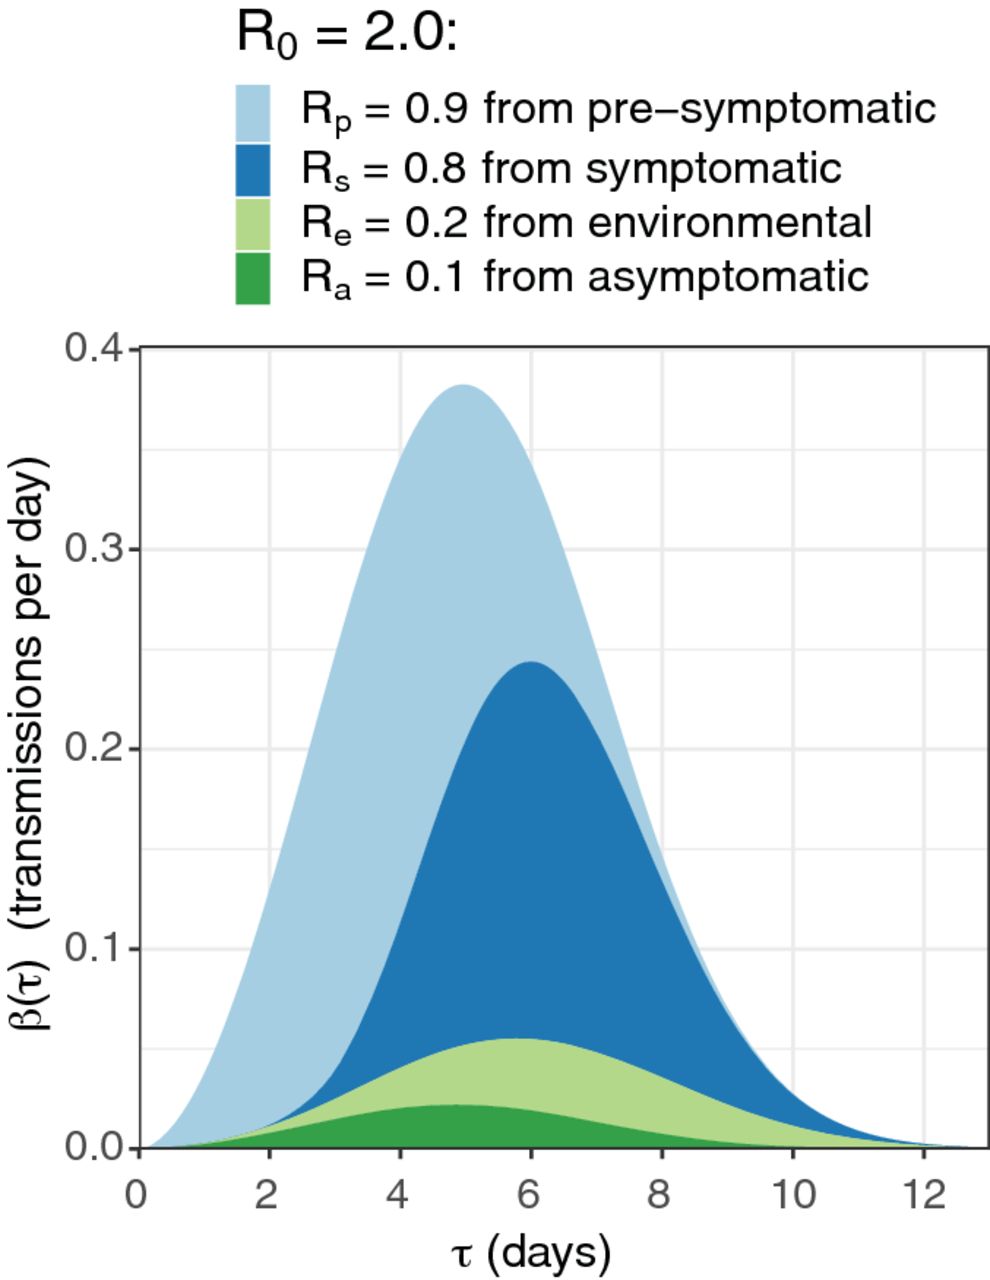
Figure showing that, without significant public health interventions, about 45% of transmissions of COVID-19 come from pre-symptomatic individuals, 40% from symptomatics, 10% from environmental sources and 5% from asymptomatic individuals.
We showed that contact tracing would need to be quick and scalable to be effective (Ferretti & Wymant et al., Science 2020).
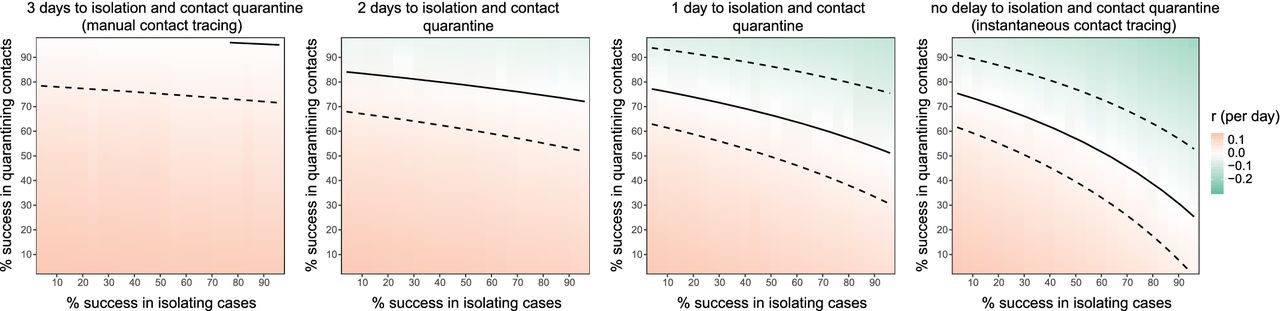
Figure to demonstrate that reducing delays (left to right) has a big impact on the success of testing and tracing. With no delays (right-most plot), successfully isolating about 50% of cases and about 50% of their contacts is sufficient to reduce the epidemic growth rate to 0.
In many countries, this was the motivation for developing digital contact tracing. An agent-based model called OpenABM-Covid19 (Hinch et al., PLOS Computational Biology, 2021) also developed simultaneously by the Fraser group, helped refine details of how tracing could and should work by modelling realistic household sizes, age-based interactions and smartphone ownership. This report to NHSX from April 2020 quantified the impacts of app uptake and design choice trade-offs.
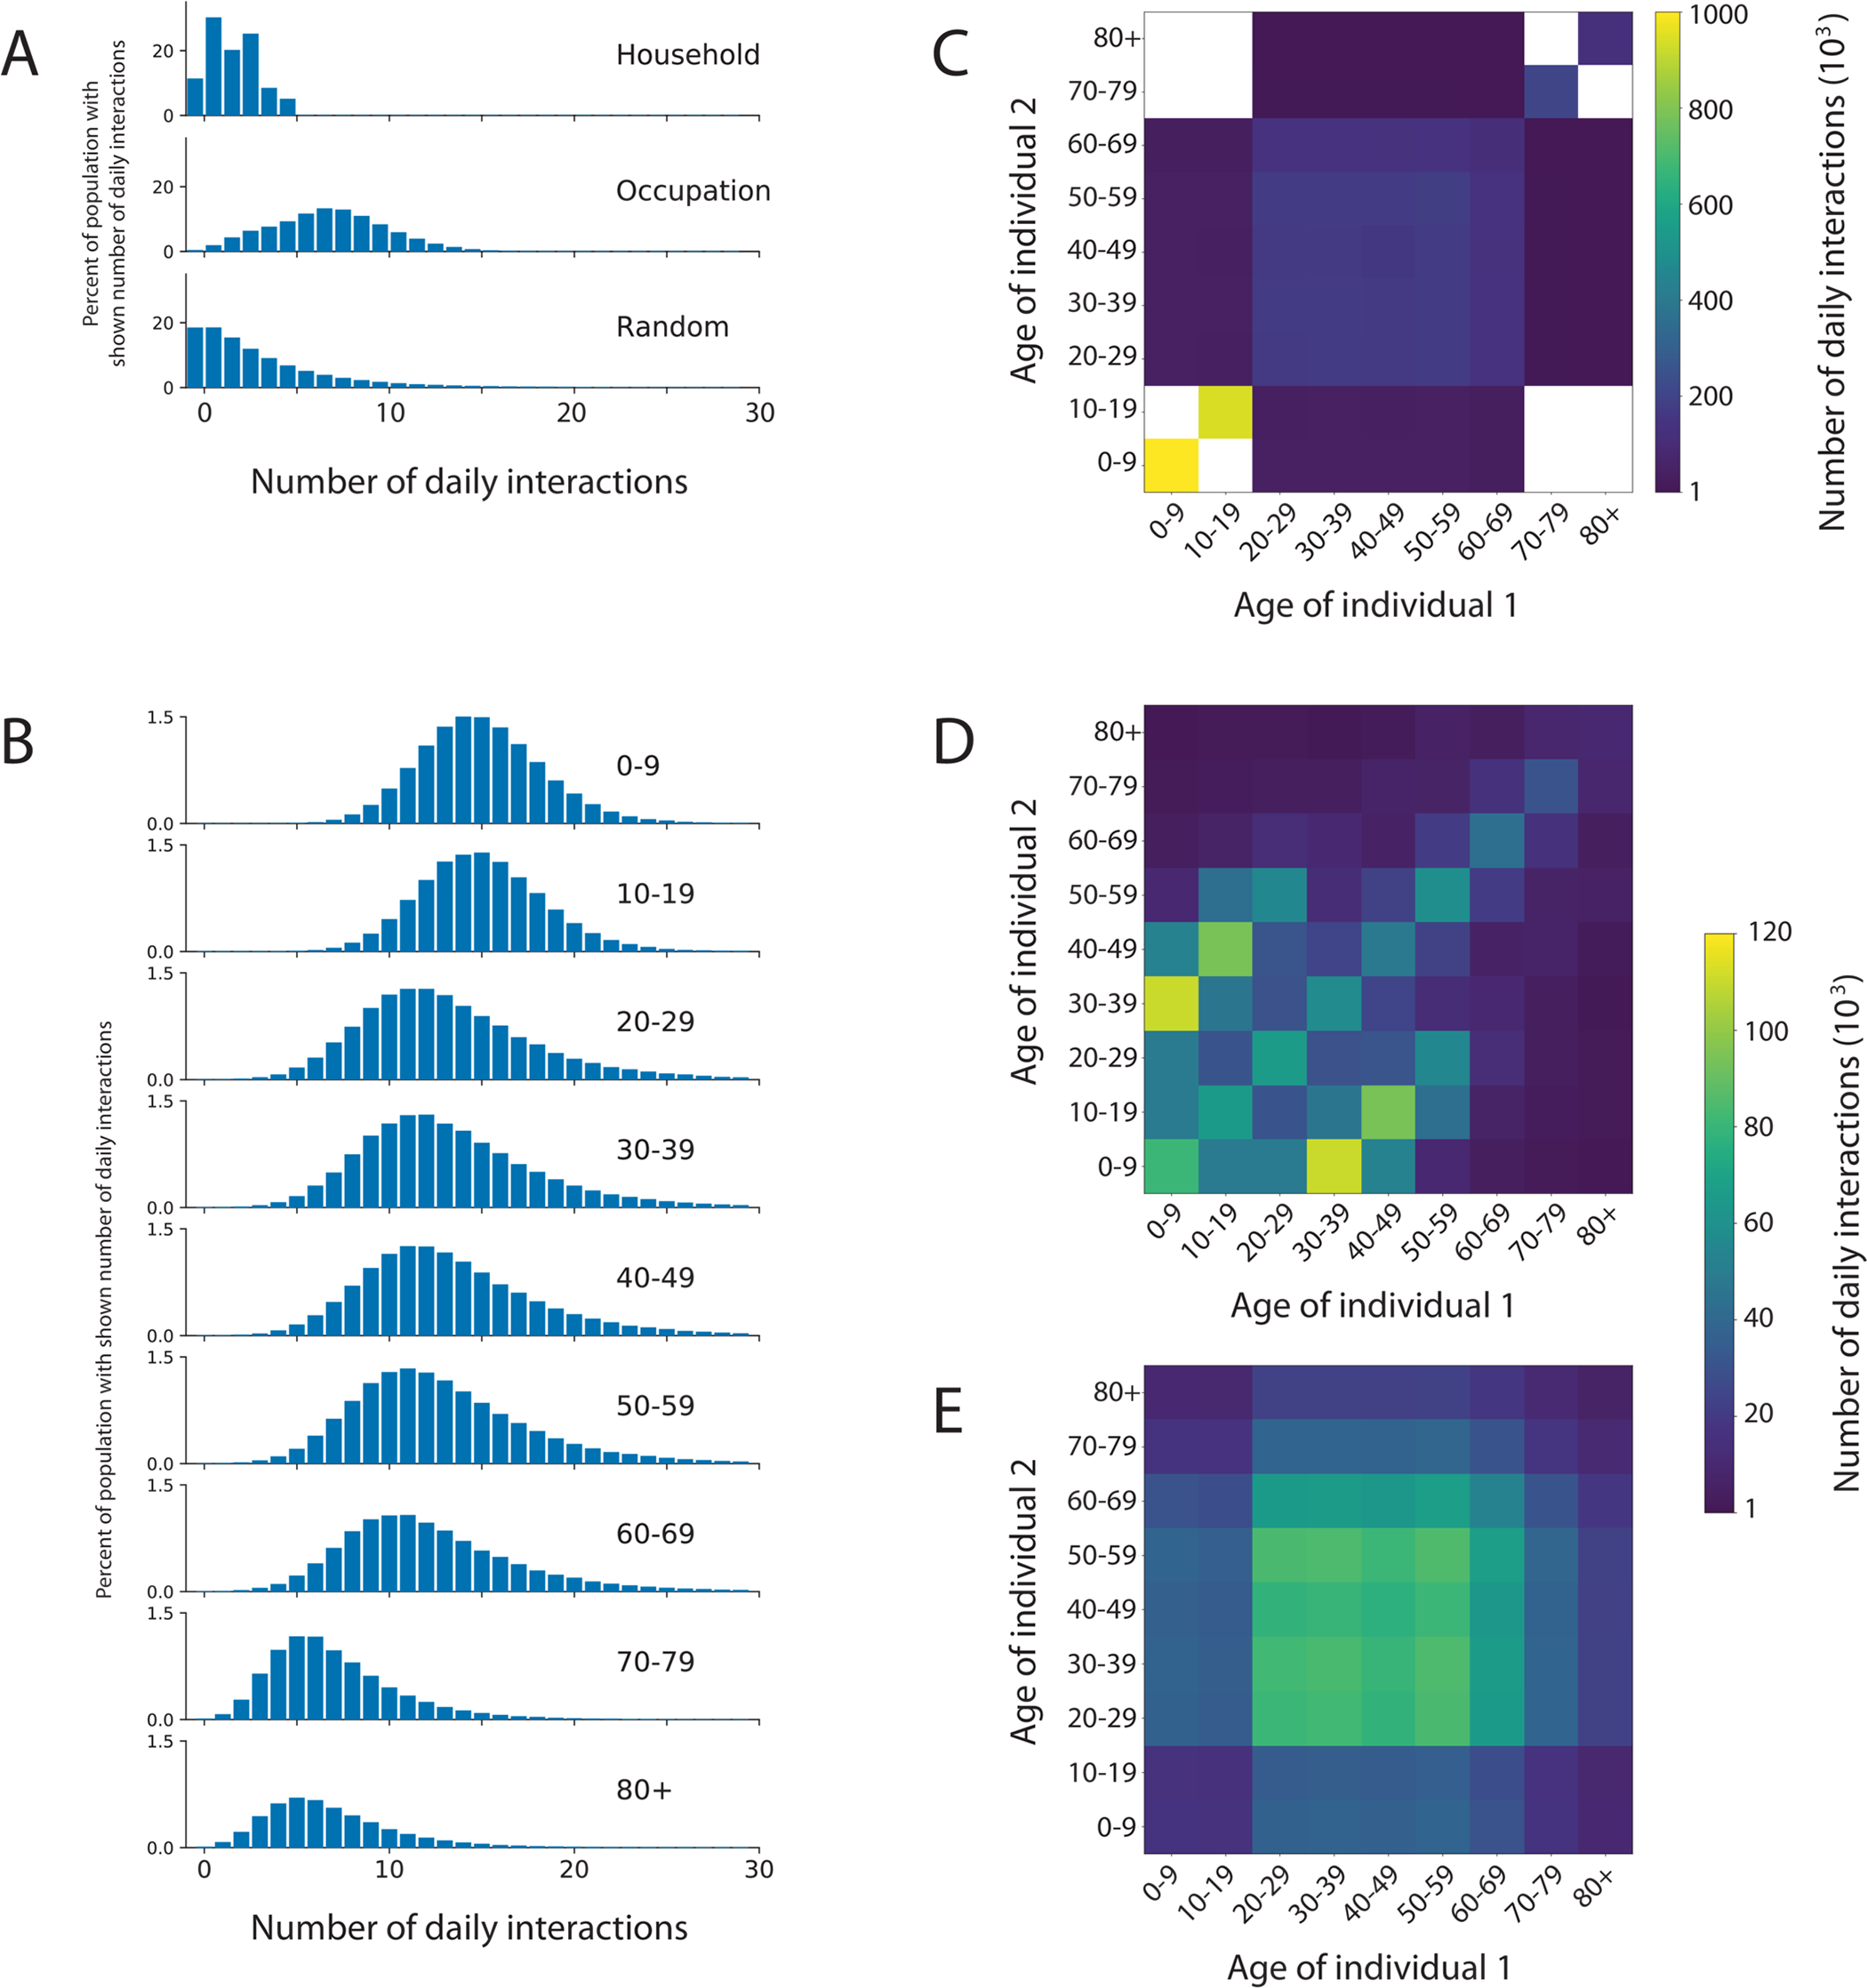
Figure showing how the OpenABM-Covid19 model allows interactions to vary by setting and by age.
A contact tracing app was launched in May 2020 on the Isle of Wight, England. We performed a preliminary analysis of its effectiveness (Kendall et al., The Lancet Digital Health, 2020). There was limited data available so we were unable to prove a causal link, but there was a promising-looking association between the launch of a Test and Trace programme on the island and a rapid improvement in its epidemic trajectory.
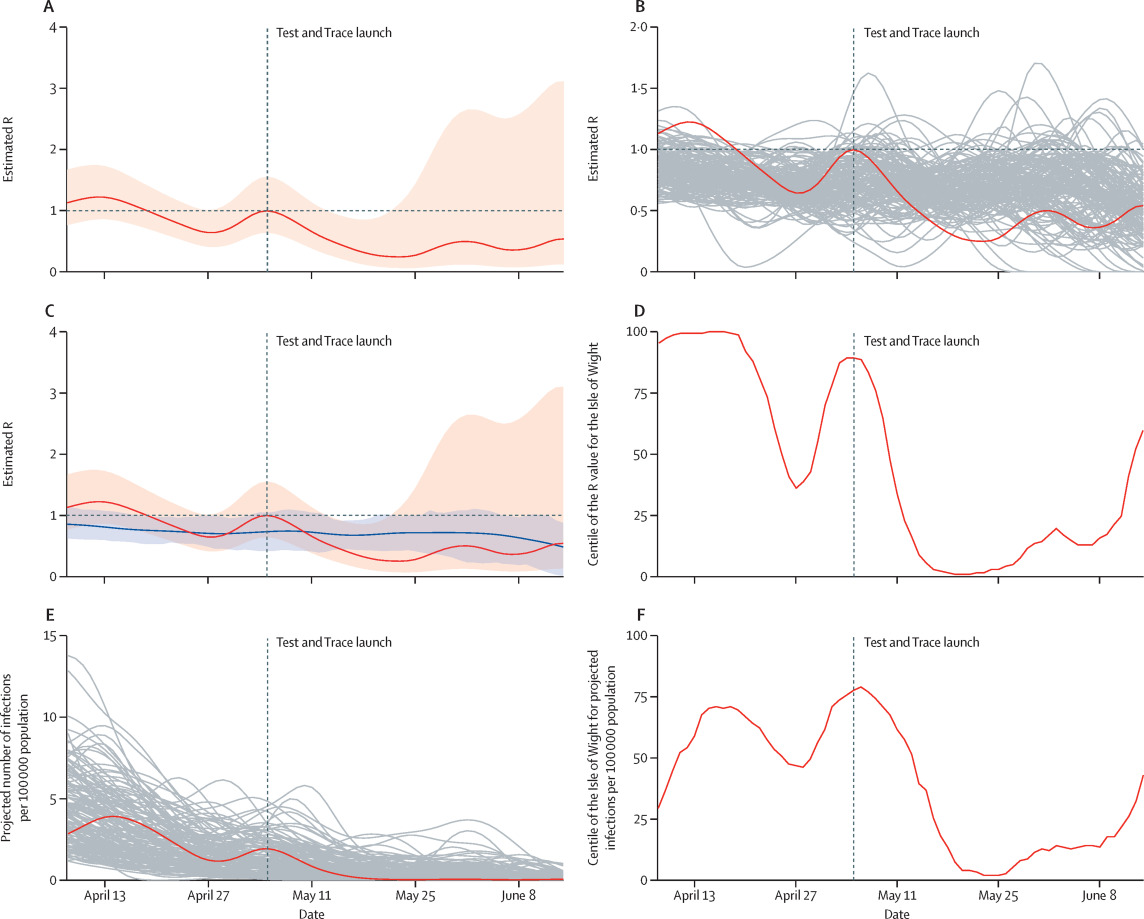
Figure showing how the epidemic on the Isle of Wight improved after the introduction of Test and Trace on the island, with a comparison to other areas (grey lines in panels B and E) and the national average of the R rate (blue line in panel C).
Meanwhile, Apple and Google had joined forces to create the Google-Apple Exposure Notification (GAEN) system, a privacy-by-design approach to Bluetooth contact tracing which enabled smooth app inter-operability across national borders and was eventually adopted by over 80 countries in total. The NHS COVID-19 app joined them on this platform in June 2020 and was officially launched for all of England and Wales in September 2020.
It featured local area information, QR check-ins for public venues, a symptom checker, access to testing and results, and the new digital contact tracing technology. Within days there were over 10 million users.
Effectiveness
We found that over its first three months of operation the NHS COVID-19 app reduced the number of cases by something in the region of 14% or 25%, depending on the method of attribution we performed in our analysis. Much of the uncertainty in our analysis is due to the privacy-preserving way it operated and the limited data that was collected, but our findings were peer-reviewed and published in May 2021 (Wymant & Ferretti et al., Nature, 2021).
We showed that for each person who tested positive and consented to contact tracing through the app during the Winter 2020 Alpha wave, this protected on average one further person from being infected and becoming a case. By comparing geographical areas with different app uptake we showed that for every percentage point increase in app uptake, the number of cases was reduced by 1-2%.
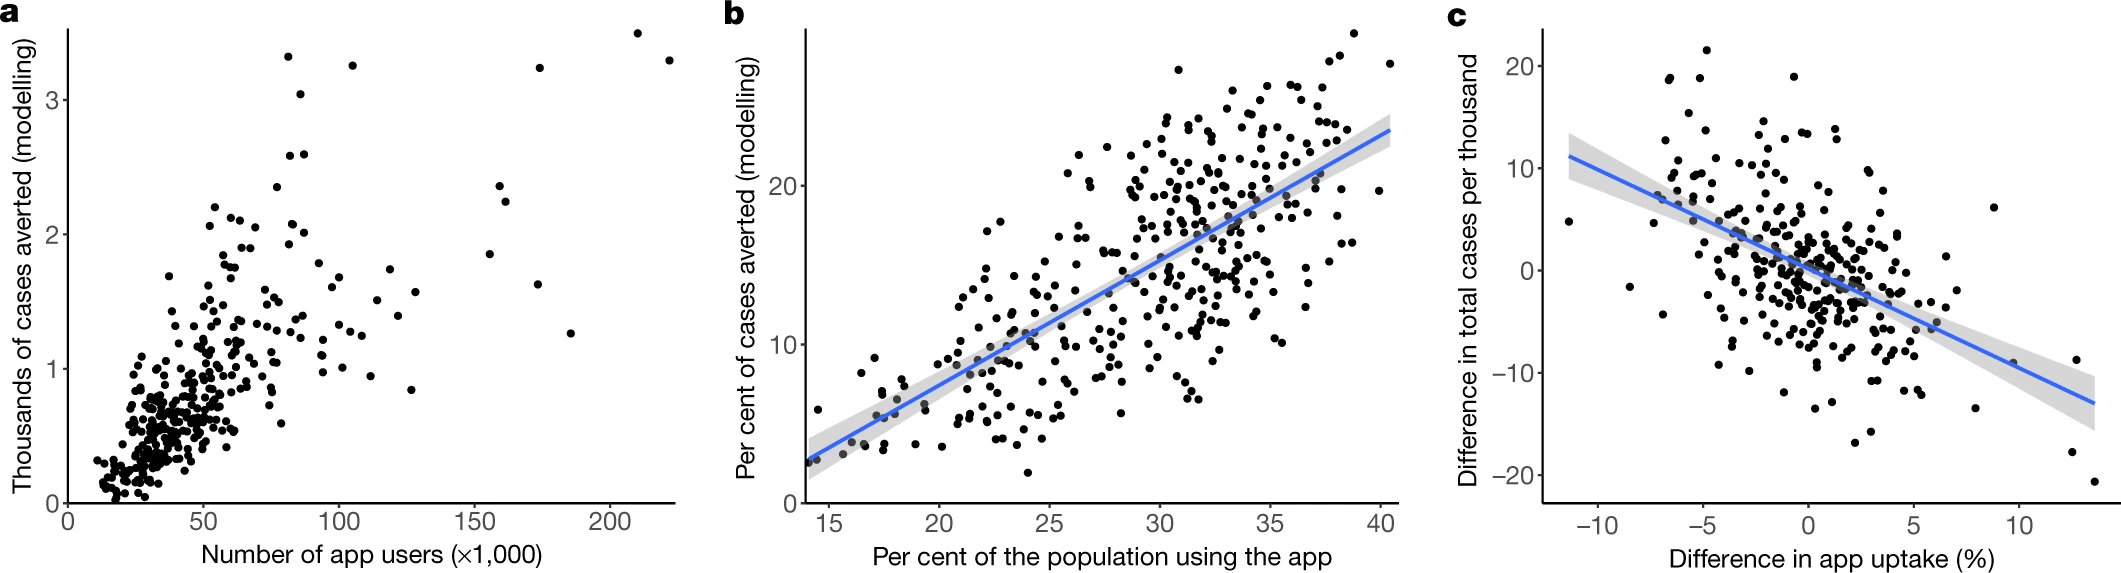
Figure showing the relationship between app uptake and cases averted in each Lower Tier Local Authority of England and Wales.
Later, we performed an analysis of the app’s first year (Kendall et al., Nature Communications, 2023). Our central estimates were that the NHS COVID-19 app averted 1 million cases, 44,000 hospitalisations and 10,000 deaths.
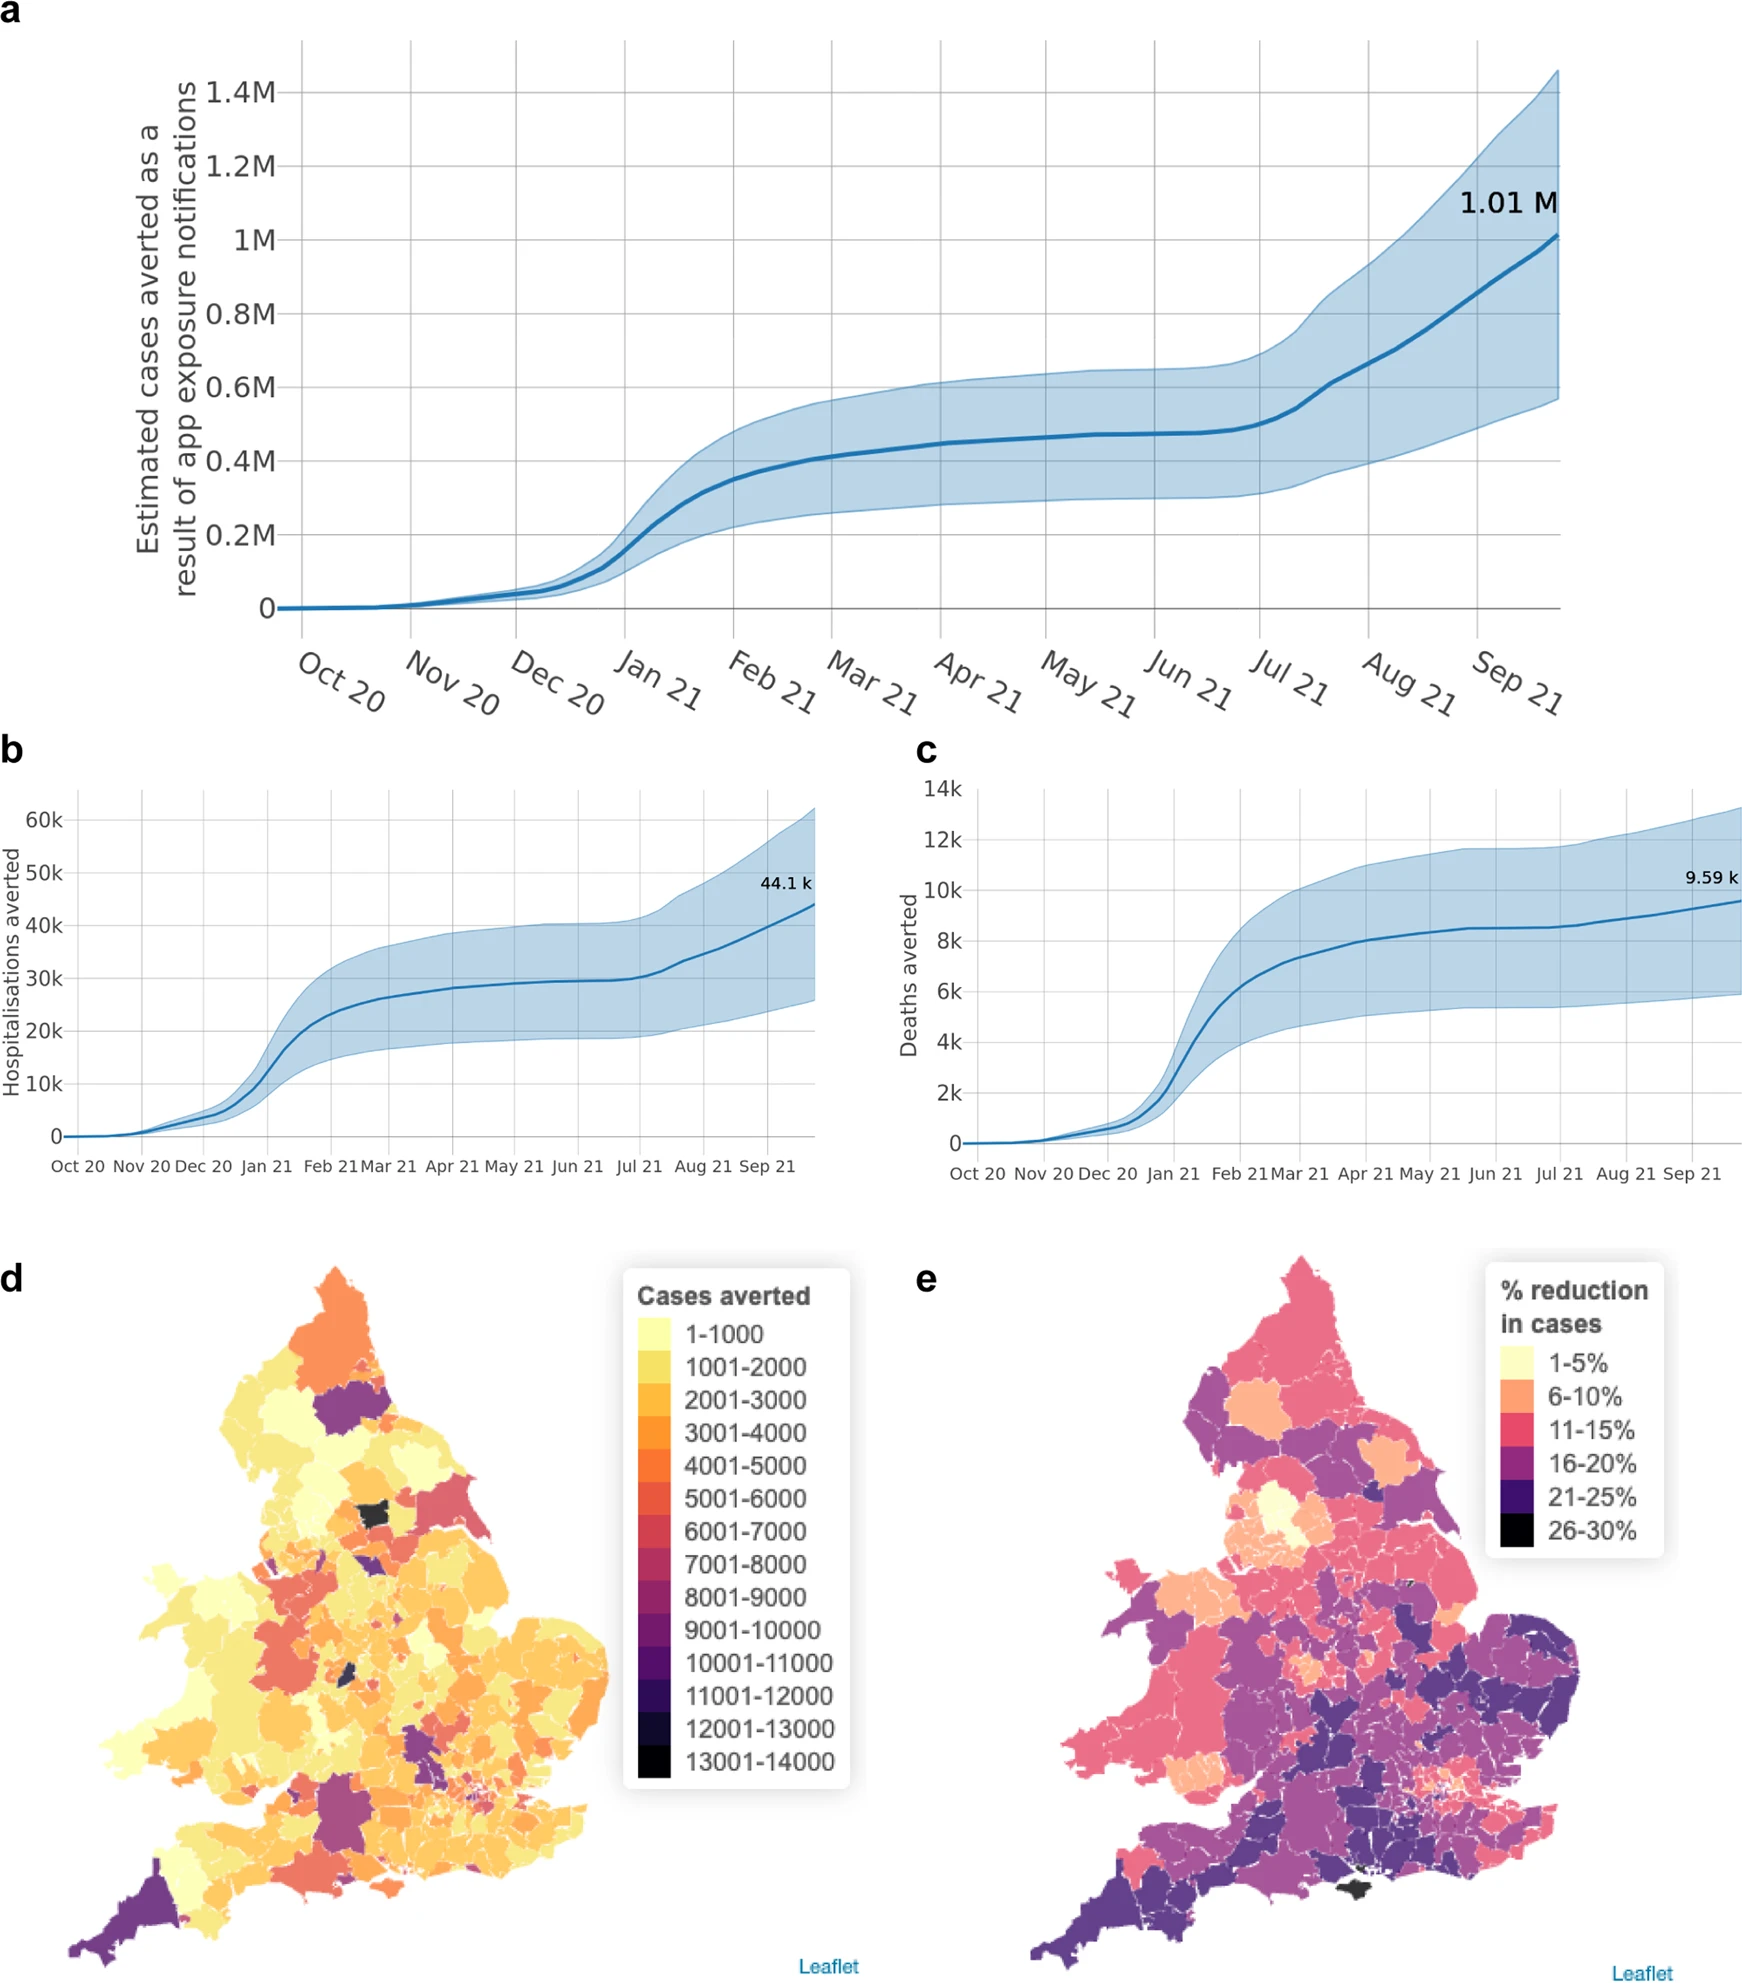
Figure showing cumulative numbers of cases, hospitalisations and deaths averted in the NHS COVID-19 app's first year.
Its life-saving impact was particularly concentrated in January-February 2021, before most of the population had been vaccinated, when it saved around 4,000 lives. The reduction in cases attributable to the app was geographically varied but peaked at almost 30% in areas which saw high uptake during times of high viral prevalence.
The app’s popularity and accuracy made it effective: a user getting an alert was always at least twice as likely to be infected as a person randomly selected from the population. At its peak in Summer 2021, a notified app user was 77 times more likely to be infected than a not-notified app user.
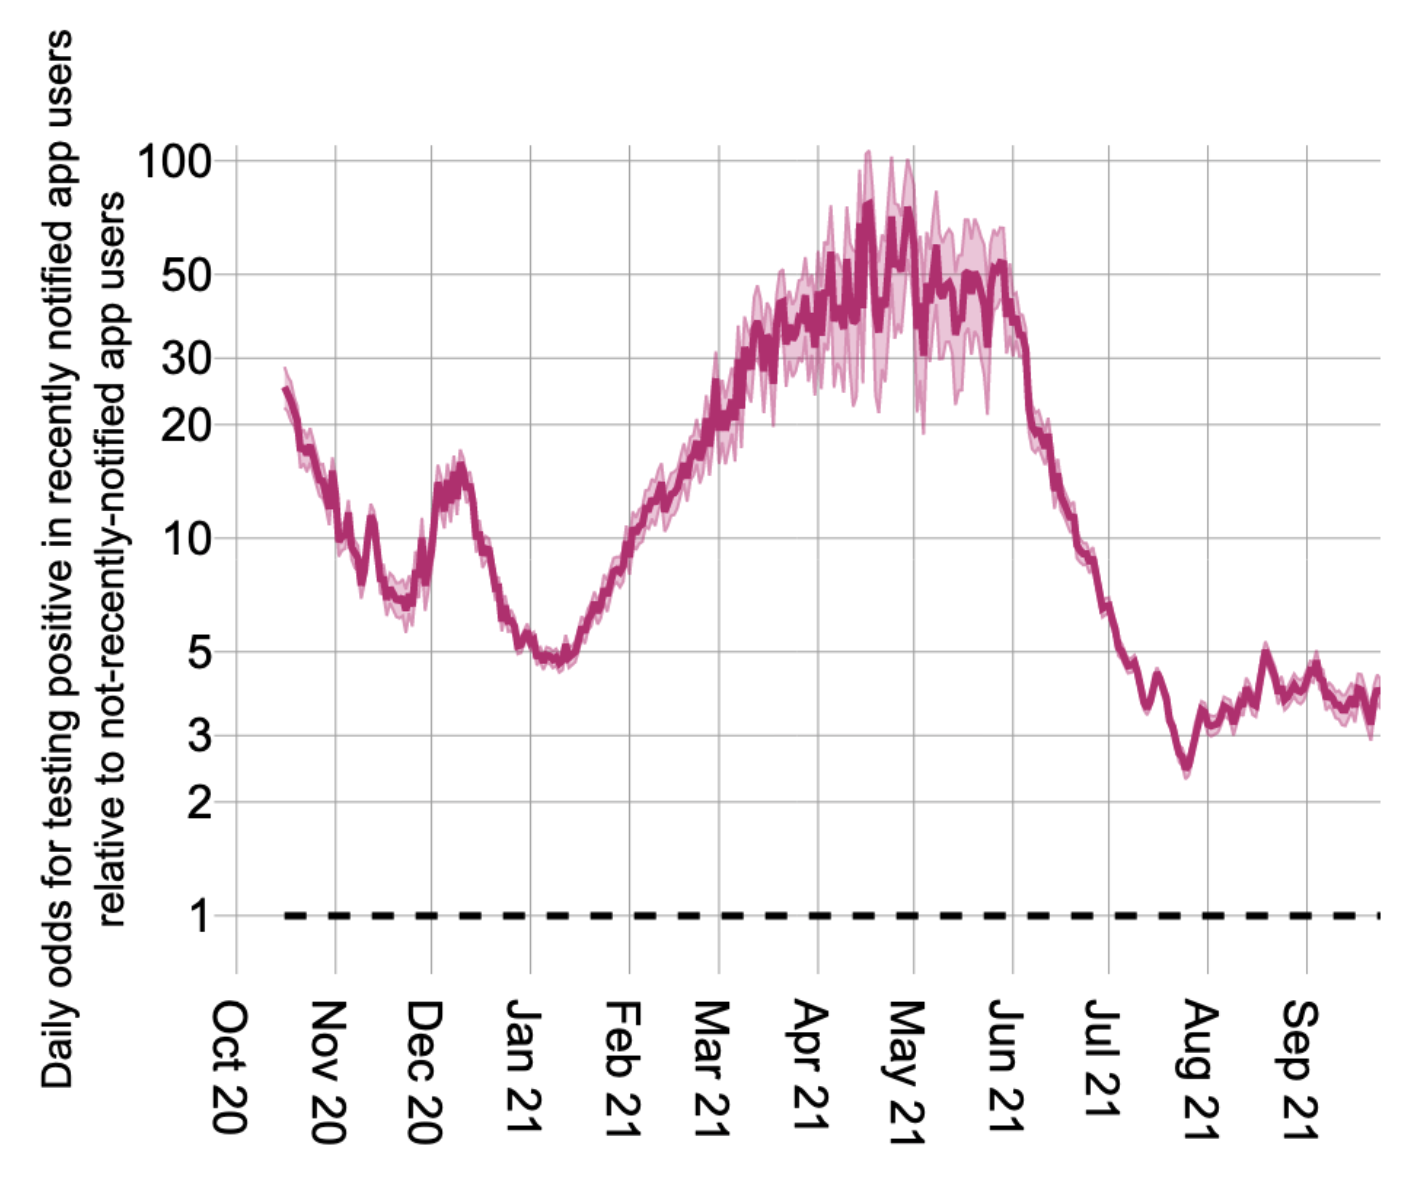
Figure showing the time-varying odds for testing positive in recently notified app users relative to not-recently-notified app users.
These were impressive achievements for a new technology built at speed during a pandemic. It was a huge collaborative effort across disciplines and countries, largely orchestrated by teams who never met in person! Frequent, rapid updates were required to maintain it in line with national policy changes and keep it certified as a medical device. Huge thanks are due to all who built it and kept it running, and especially to the more than 18 million users in England and Wales.
After its first year, app usage declined as vaccines - thankfully - did most of the life-saving work, but it continued to help reduce pressure on the NHS. Each week in 2022, 30-60% of nationally-registered positive tests were reported via the app, and thousands of contacts were traced.
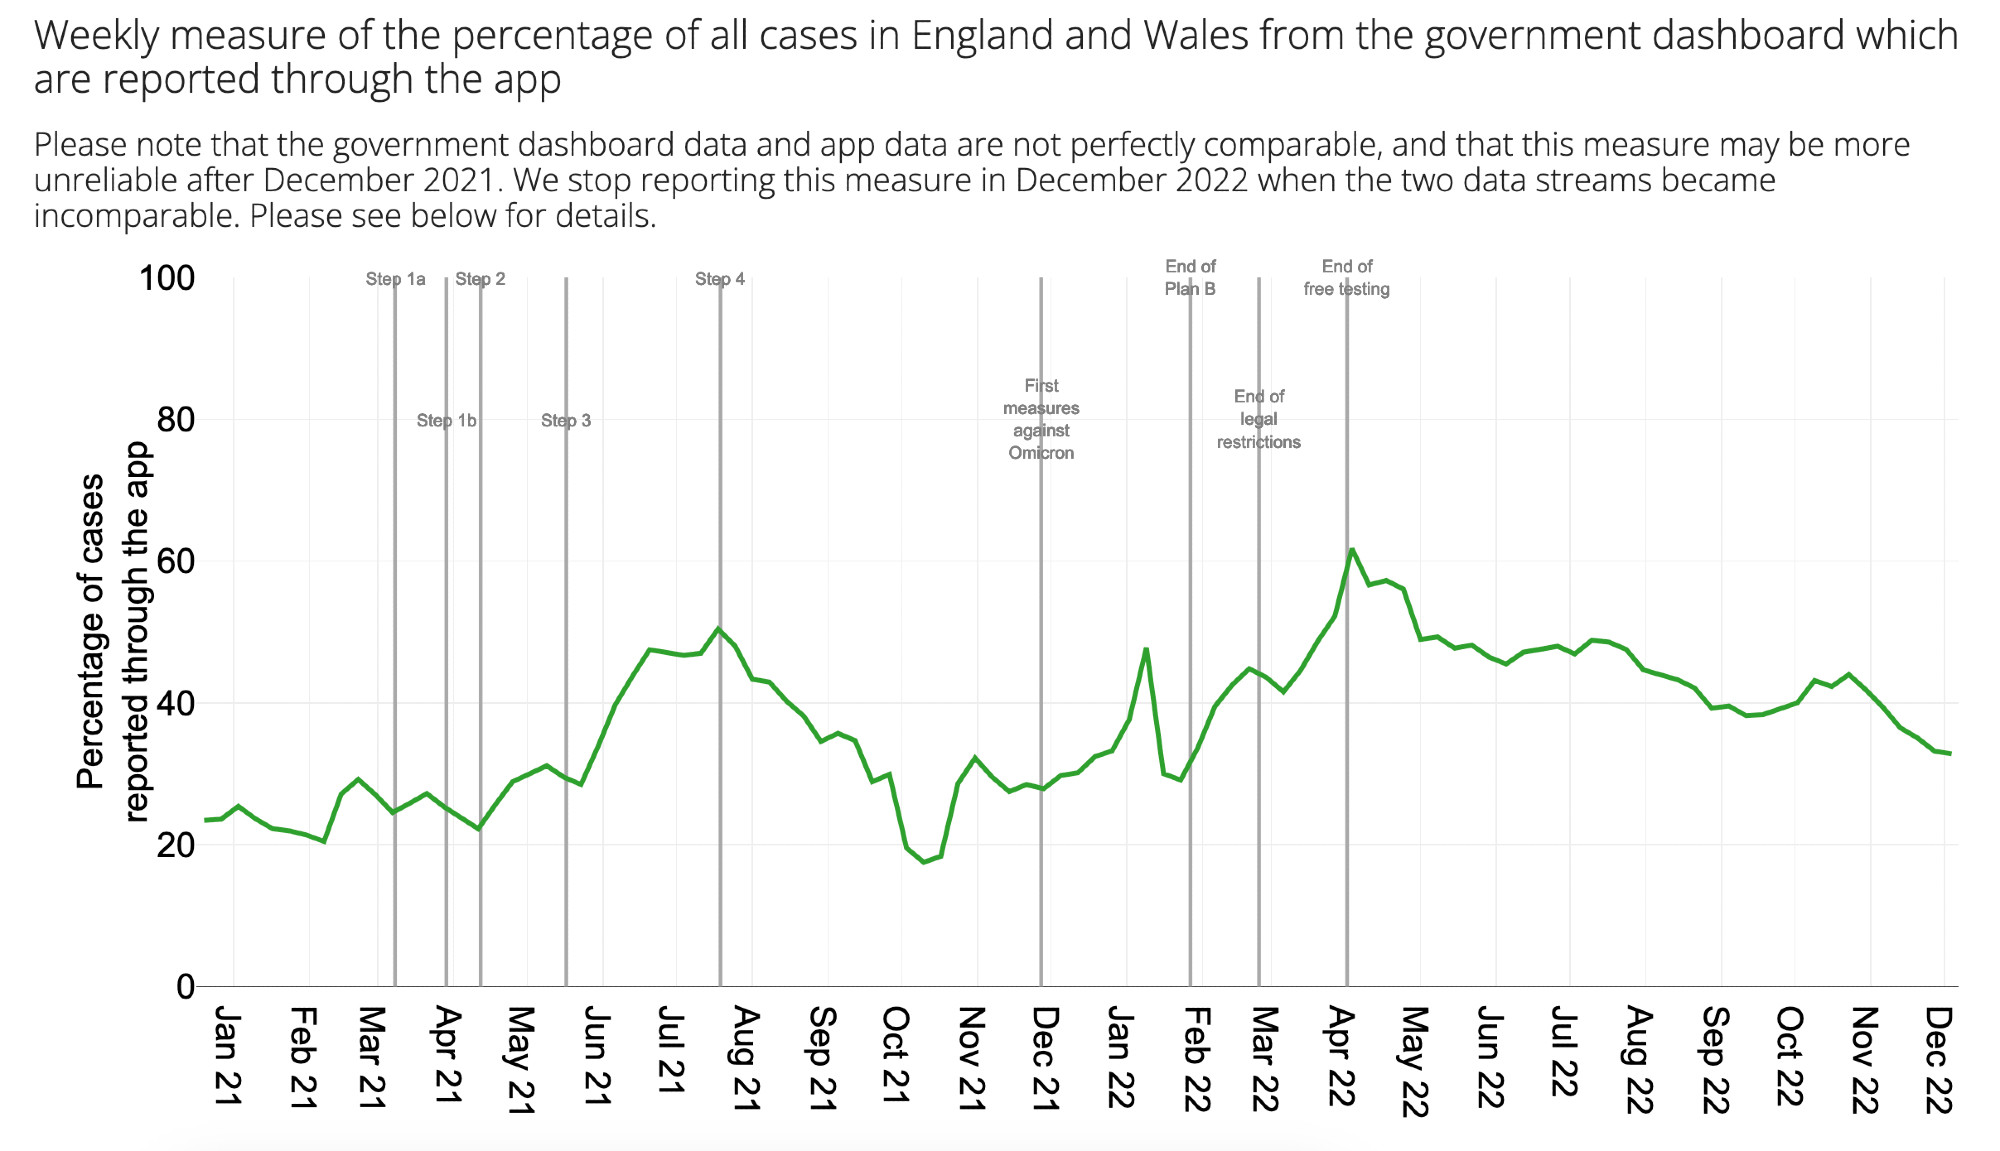
Figure showing the percentage of cases in England and Wales from the government dashboard which were reported through the app each week.
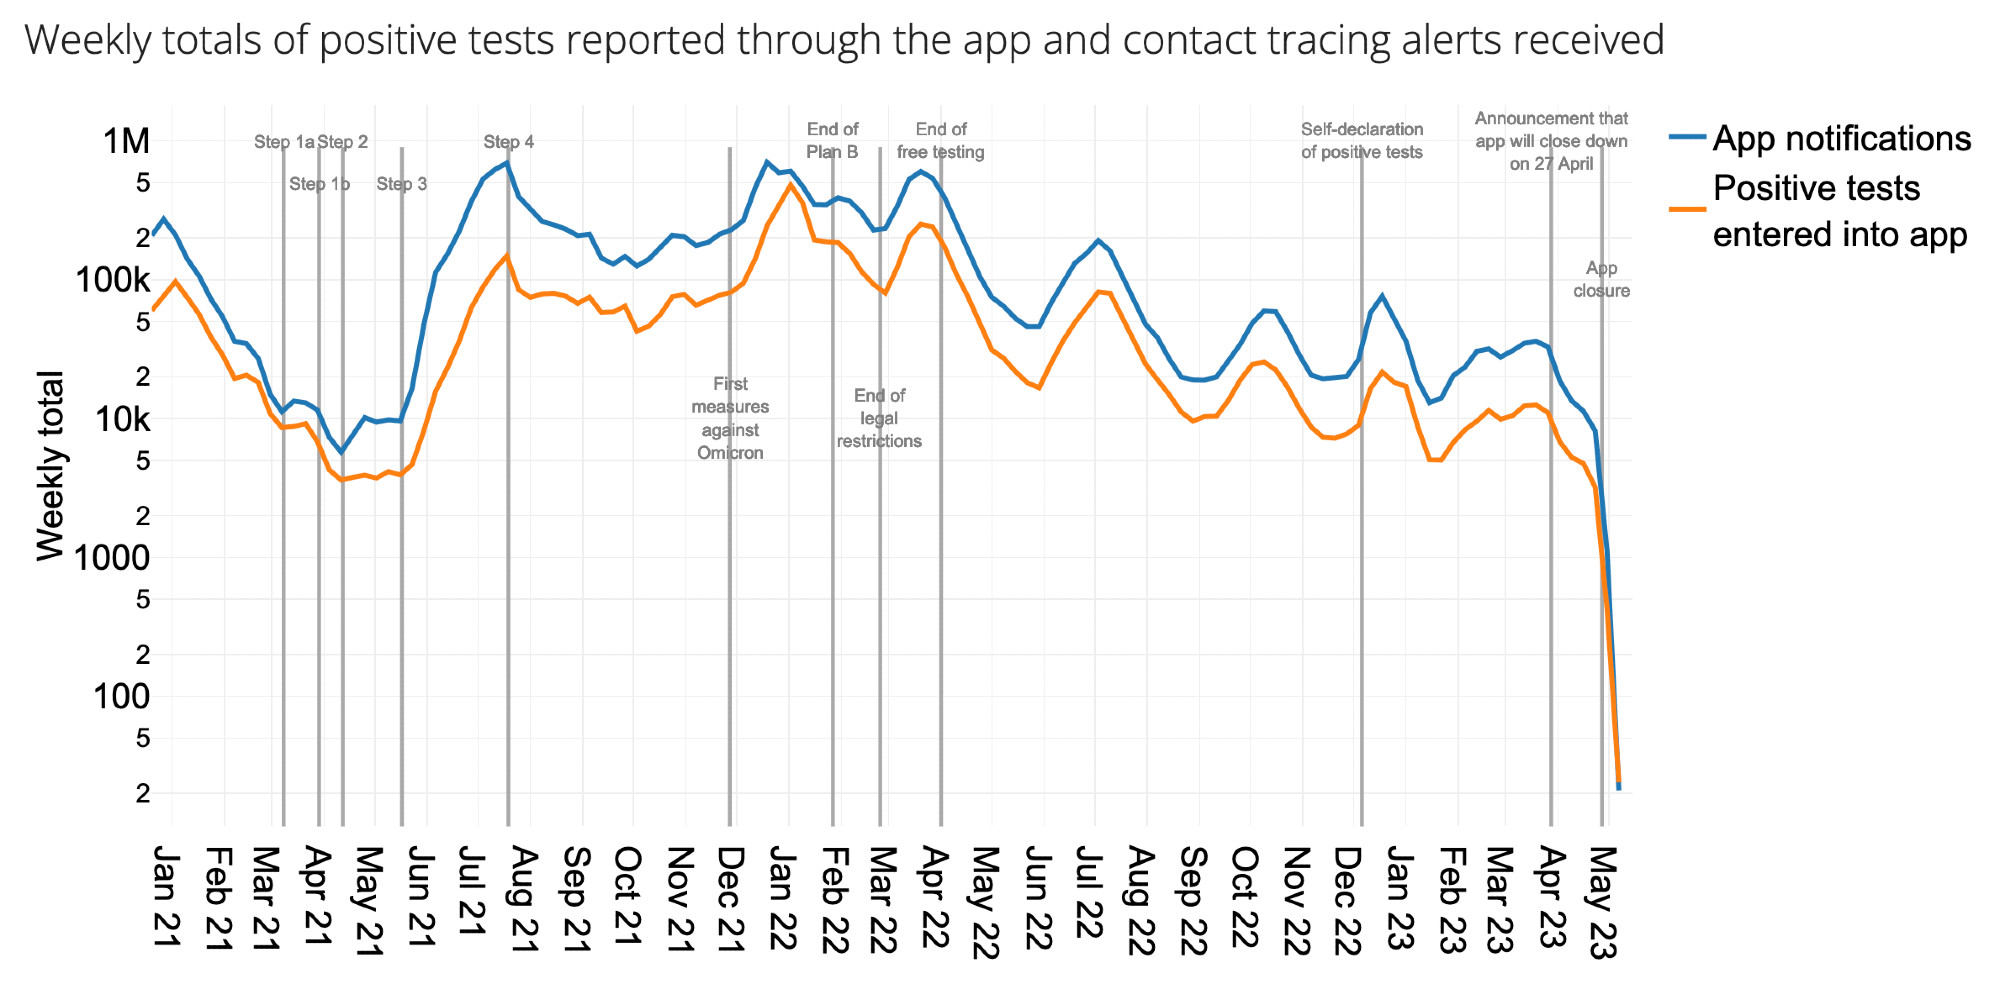
Figure showing totals of positive tests reported through the app and corresponding contact tracing alerts received each week.
These app statistics can be explored in more detail in this Shiny web app.
But that’s not all!
Epidemiological insights
The huge user base and near-instant data collection from the NHS COVID-19 app meant that we could gain some epidemiological insights that had never before been possible. By analysing 7 million contacts captured by the app (Ferretti et al., Nature, 2023), we were able to better understand what constituted a ‘risky’ contact: the duration and proximity of contact which meant that an infectious individual was likely to pass on the virus.
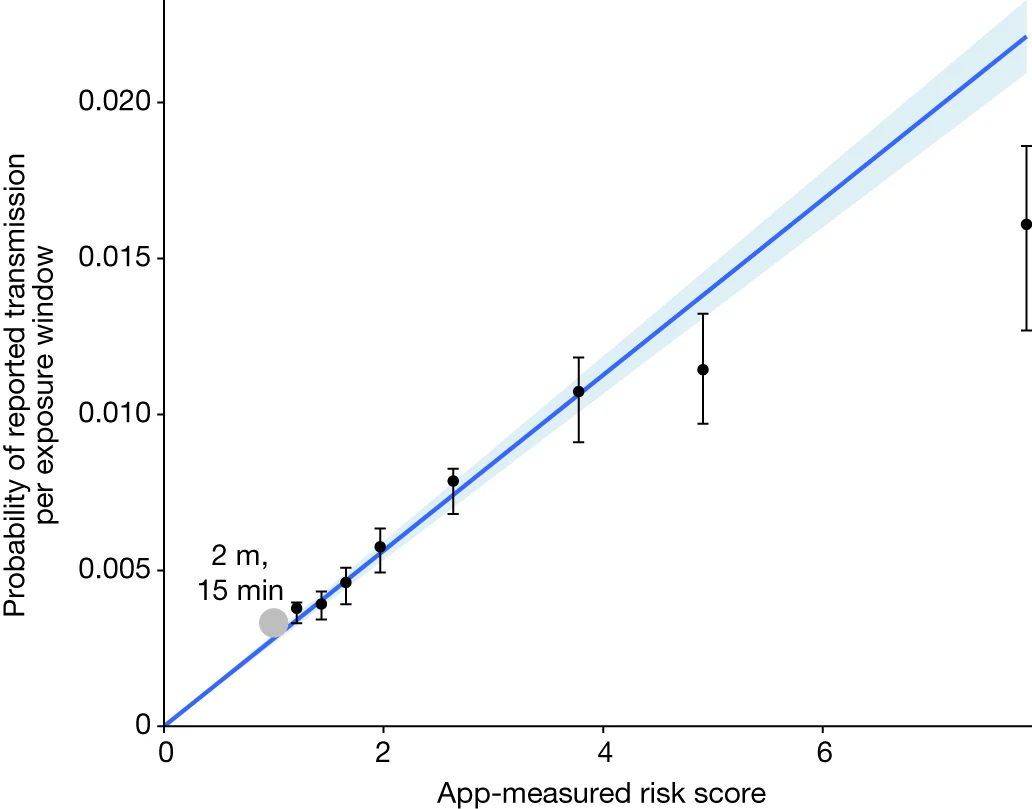
Figure showing the probability of reported transmission as a function of the app-measured risk score of a 30-minute exposure window.
It turned out that the app was good at measuring the riskiness of a contact, and further, we could analyse the data to find for the first time the relative importance of duration and proximity. Duration was particularly important. Whereas most exposures were short (median 0.7 hours, interquartile range 0.4–1.6), transmissions typically resulted from exposures lasting between 1 hour and several days (median 6 hours, interquartile range 1.4–28). Households accounted for about 6% of contacts but 40% of transmissions.
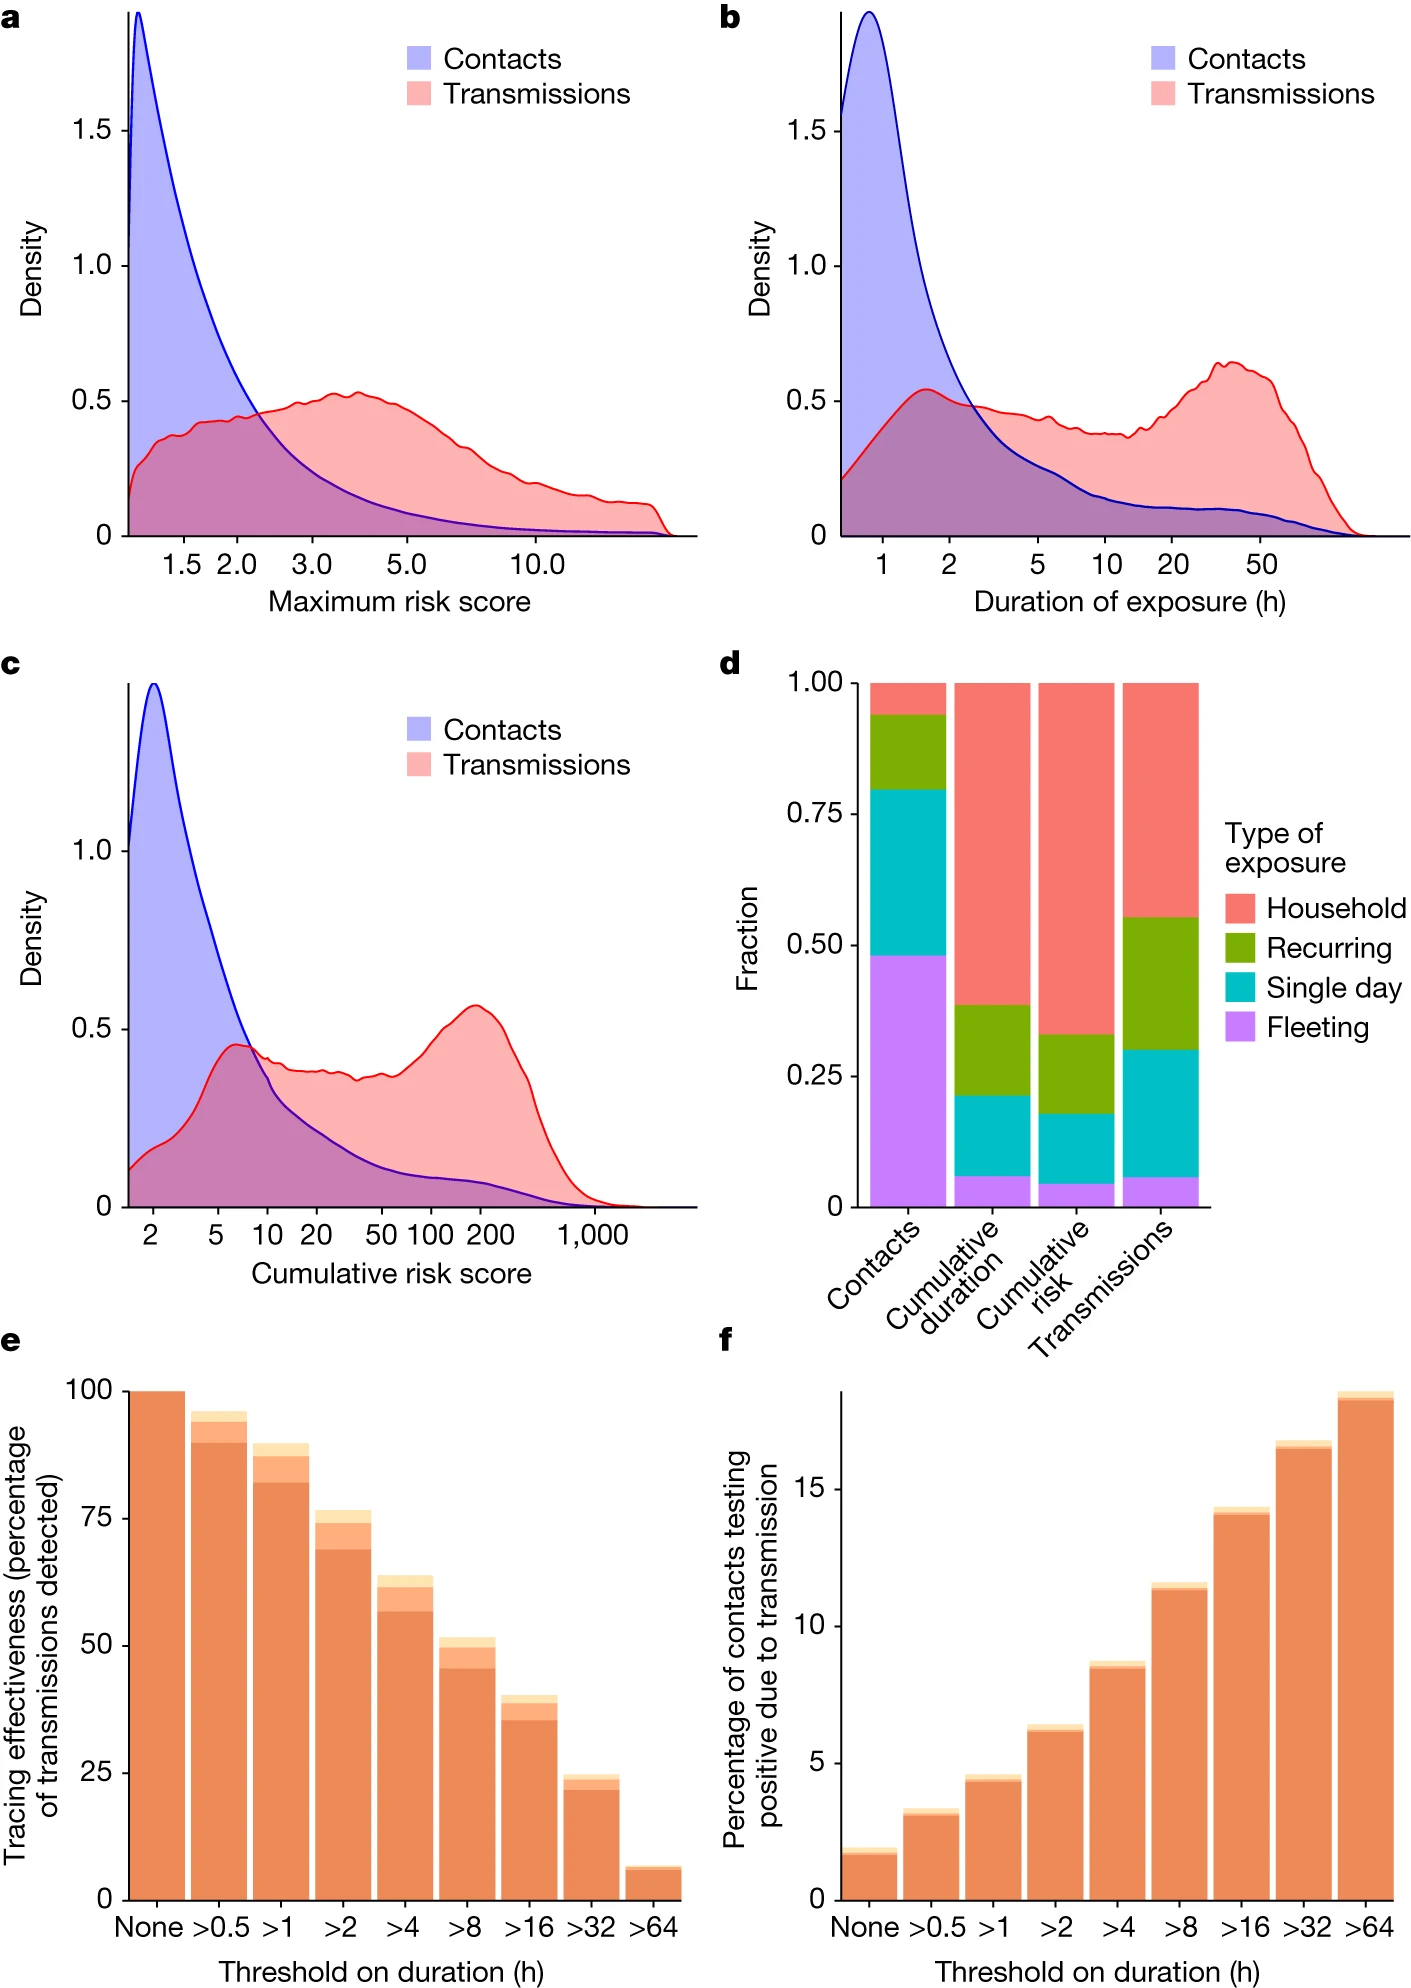
Figure showing how short, intermediate and long exposures all contribute to COVID-19 transmission.
Finally, app data provided near real-time insights into the drivers of the epidemic (Kendall & Ferretti et al., Science, 2024). We could see if a wave was driven by an increase in contact rates or infectiousness of new variants, and vaccination-driven decreases in infectiousness per contact were clearly visible.
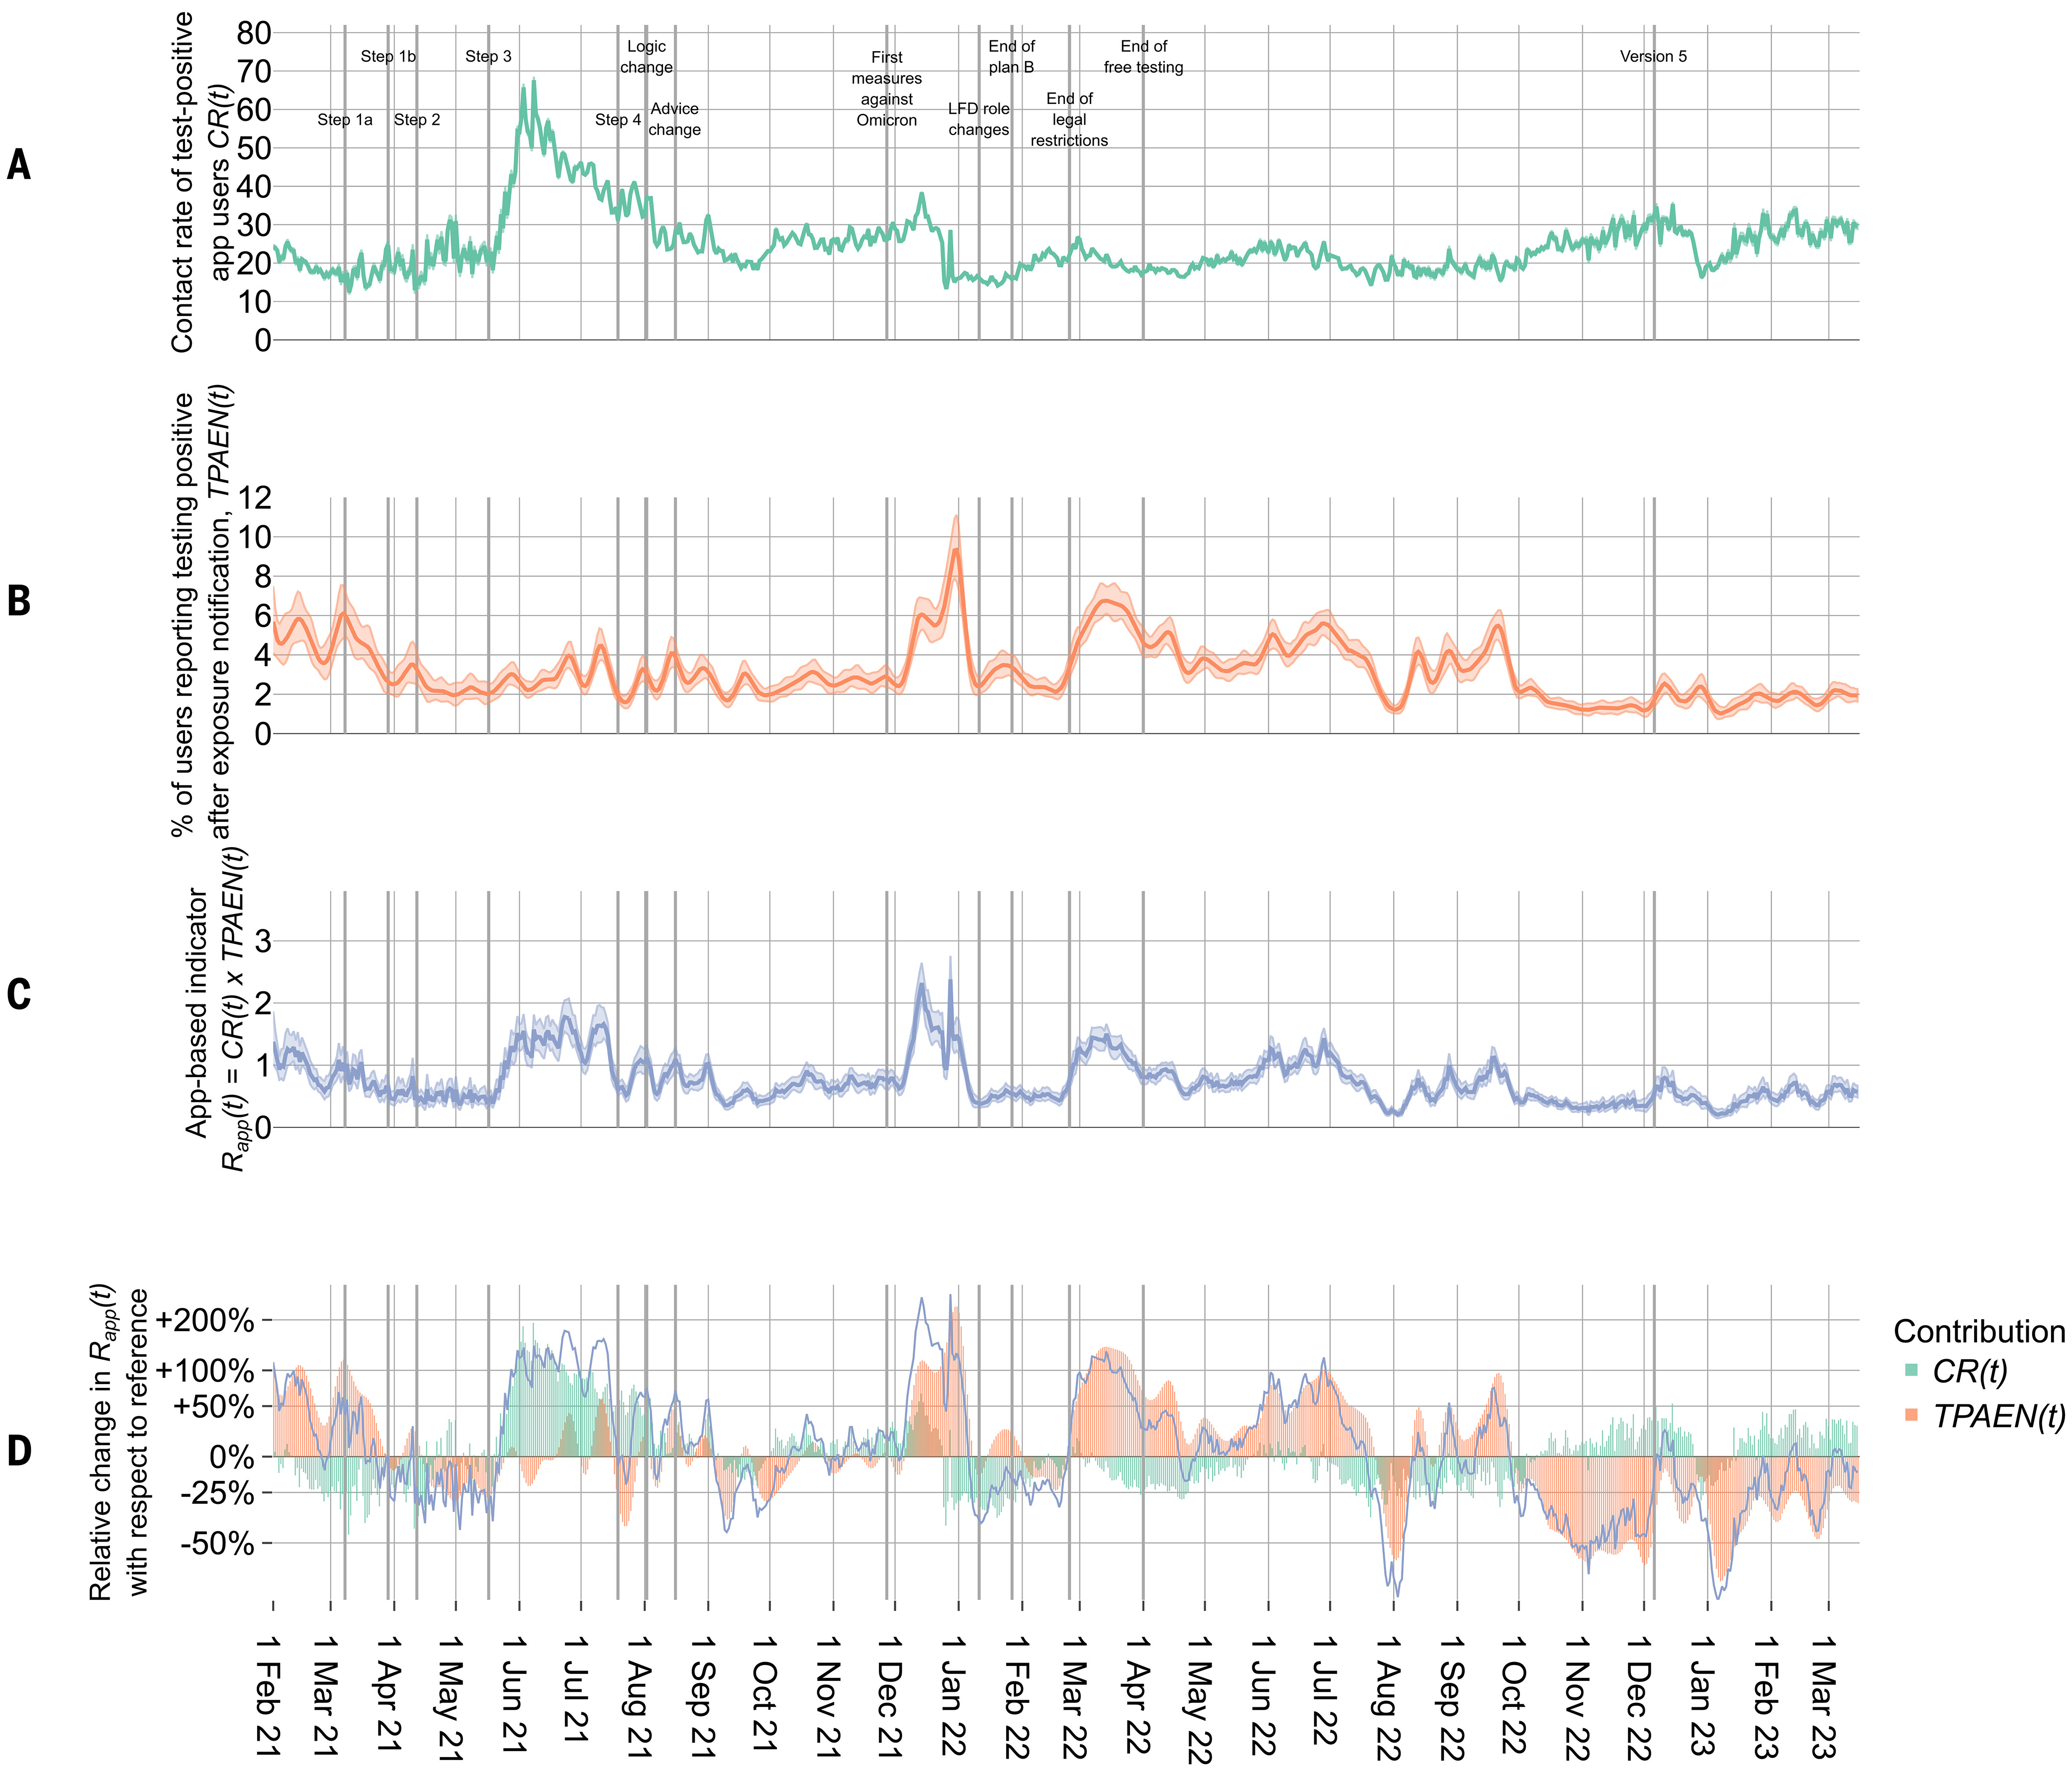
Figure showing how the app captured contact rates, infectiousness and thereby an indicator of the reproduction number, R.
Analysis of app data provided a leading indicator of the reproduction number R, available at least 5 days earlier than other estimates. This provided valuable situational awareness for policy makers.
In addition, the data captured fine-grained insights into the drivers of transmission, including the effects of day-of-the-week, setting (longer vs more fleeting contact), and geographical region.
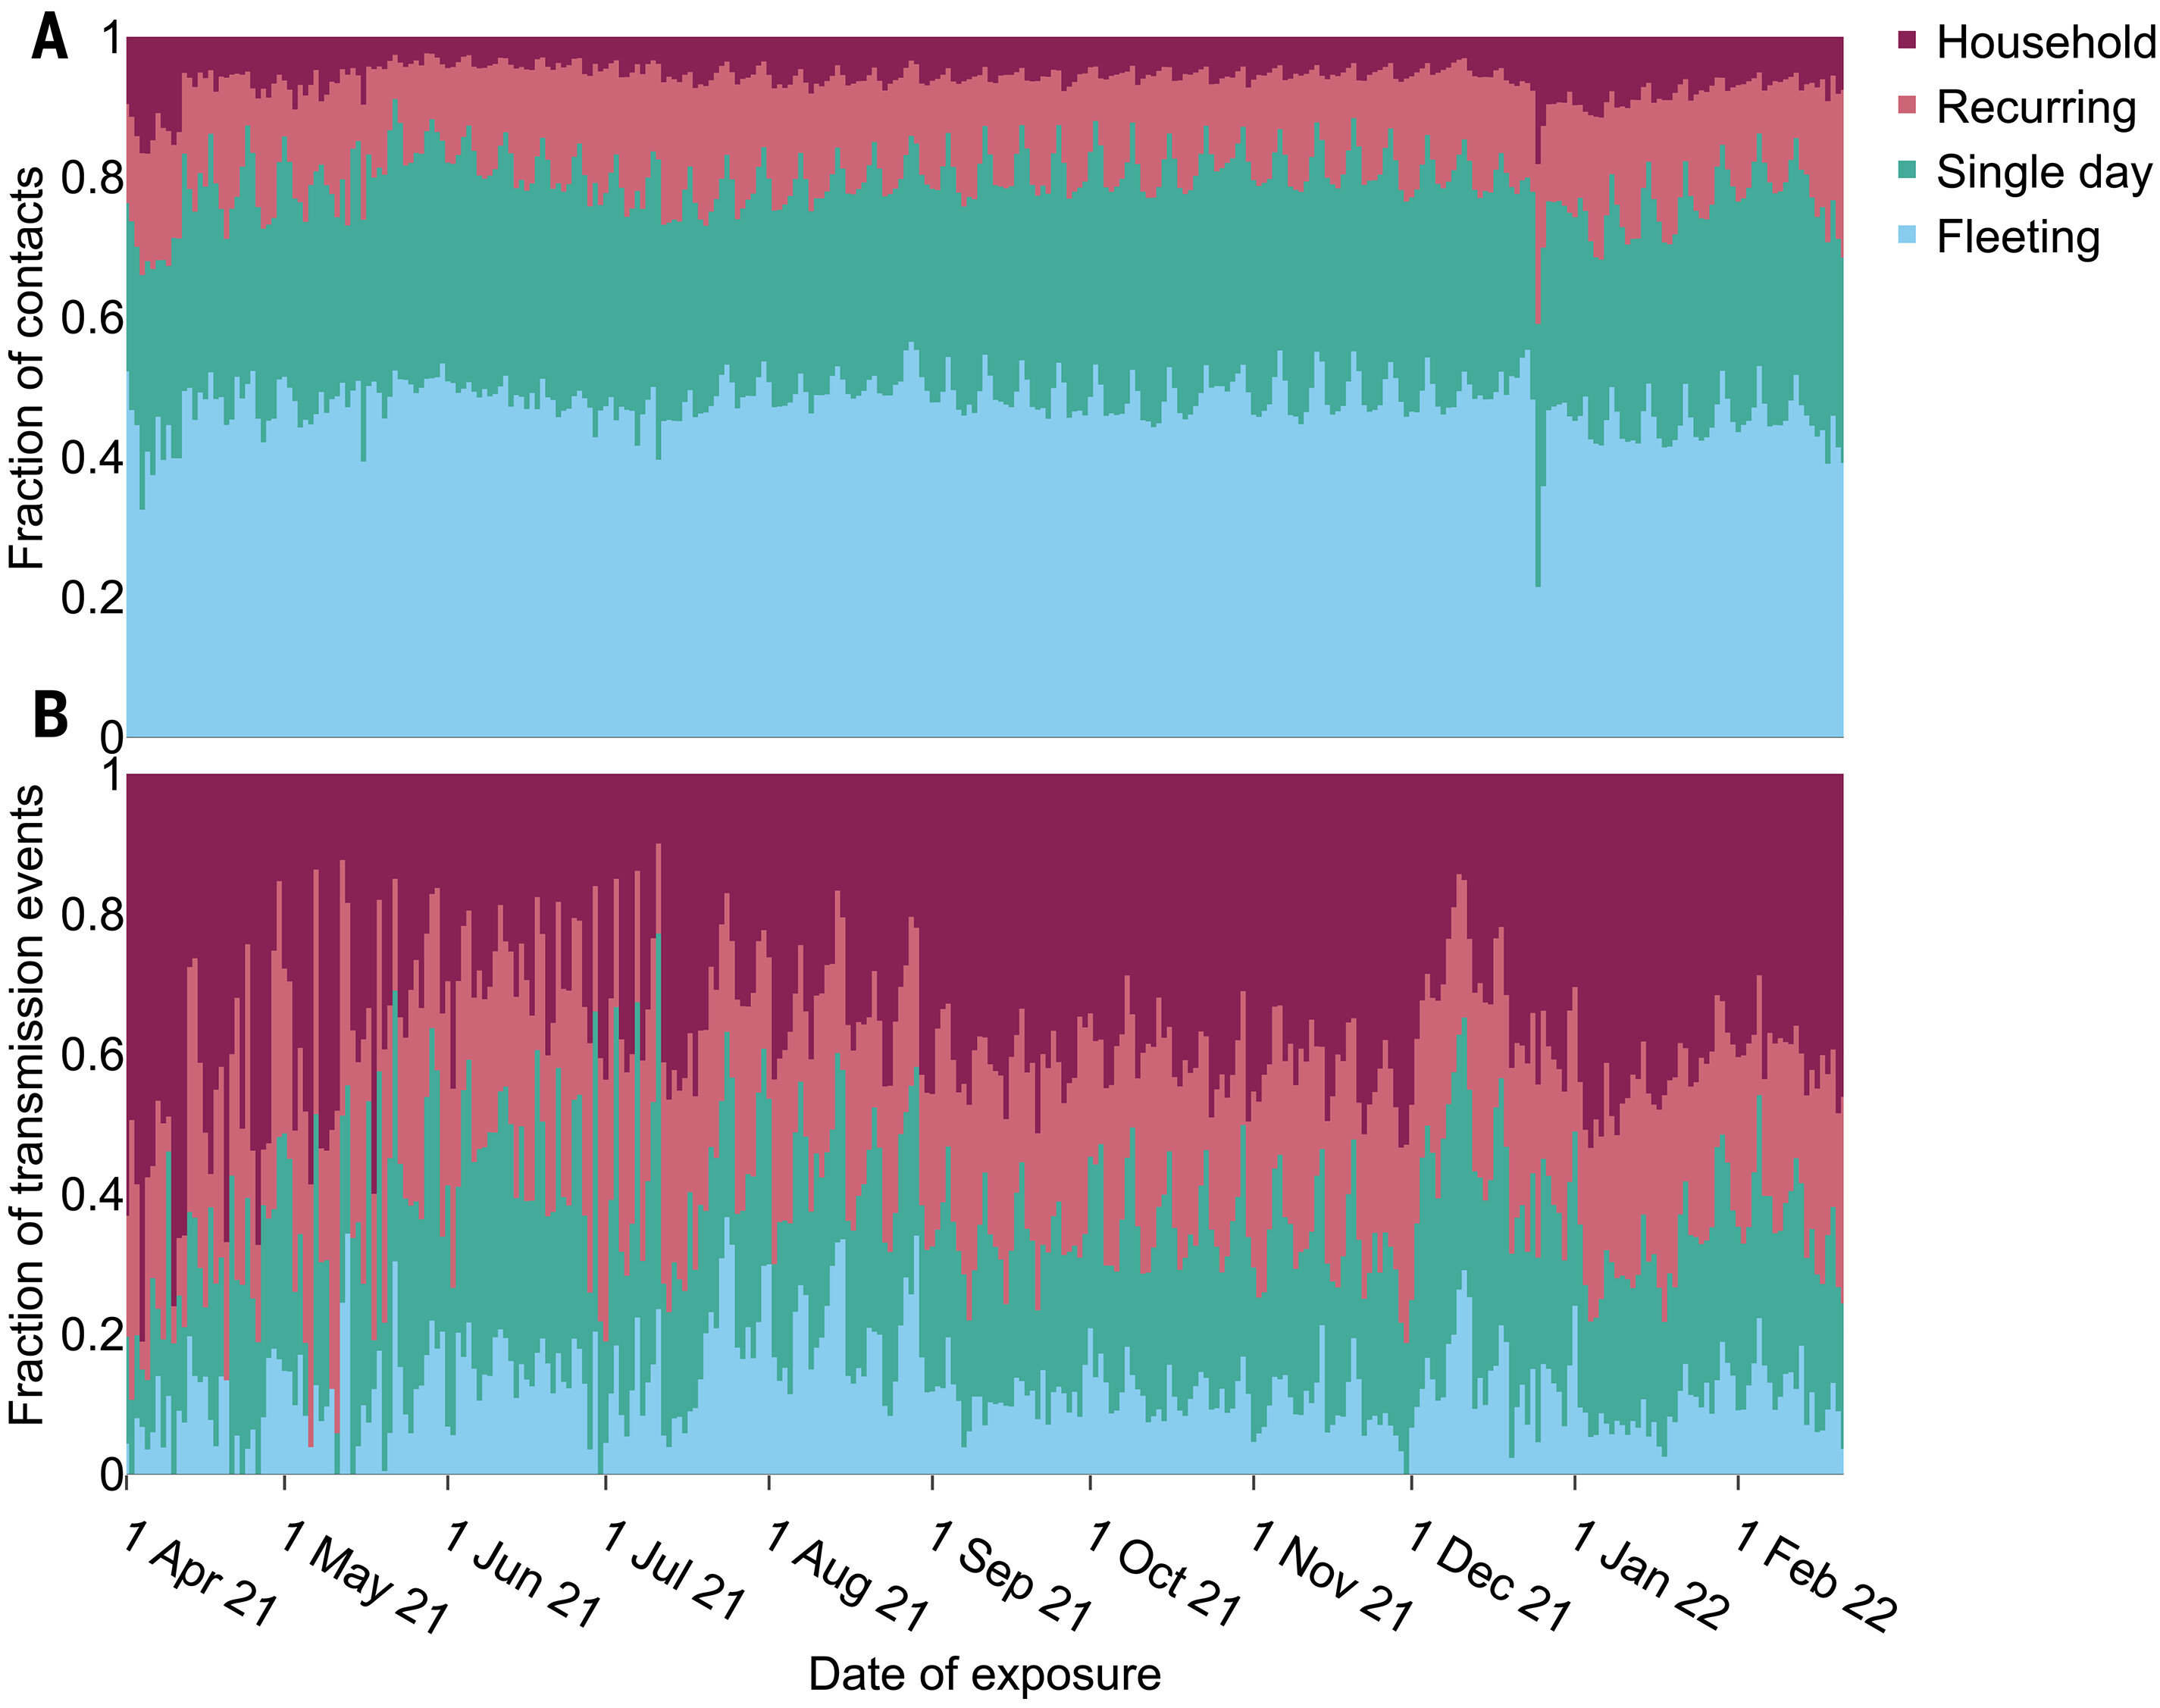
Figure showing relative daily fractions of contacts which were from households, recurring, single day or fleeting encounters, and the corresponding proportions of transmissions.
Christmas Day stood out as having many more household contacts and fewer fleeting contacts than usual. The Euros in Summer 2021 were associated with big increases in spread, driven by synchronised (likely inter-generational) meet-ups across England and/or Wales - you could even see the two countries’ different match days highlighted as spikes in the data. Excess transmissions on Euro match days accounted for 29% of all app-recorded transmissions during the month-long tournament.

Science magazine cover showing England football fans in Wembley stadium, titled "Transmission Event: Digital contact tracing for COVID-19".
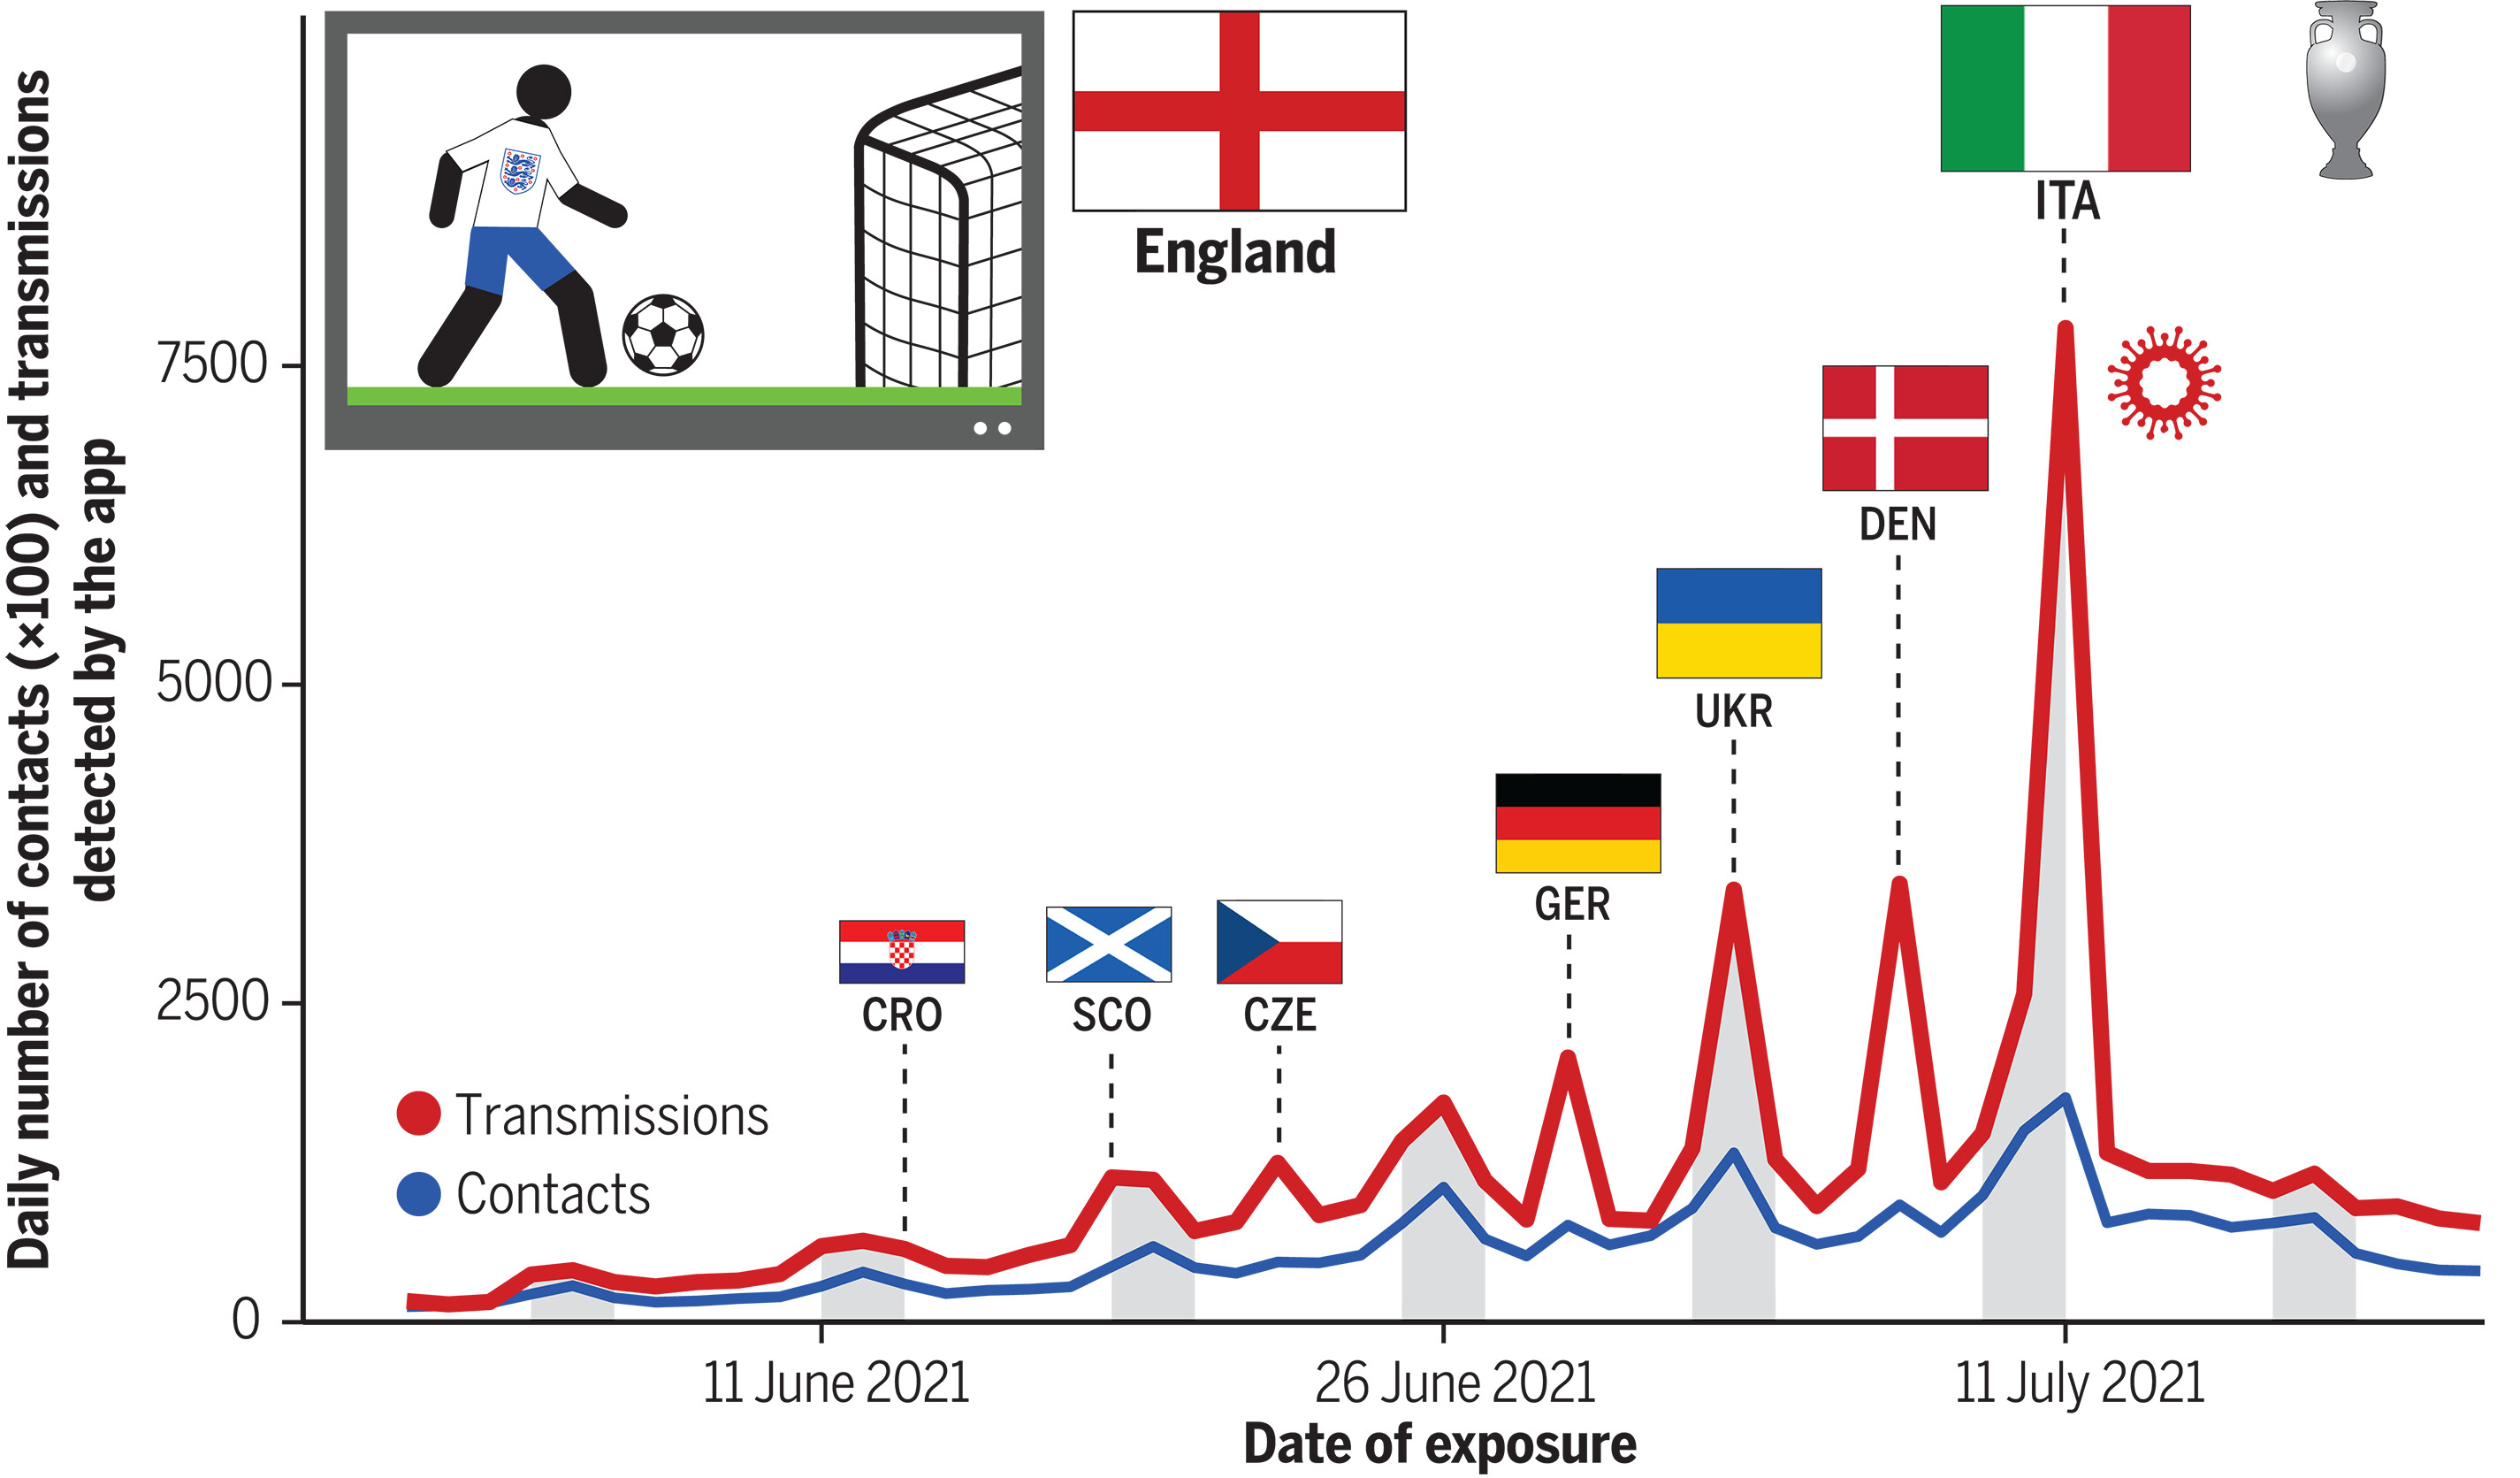
Figure showing contacts and transmissions associated with England match days during the Euros.
In summary, the NHS COVID-19 app was a relatively low-cost intervention which was effective in achieving its primary aims of reducing transmission and provided unprecedented insights into the SARS-CoV-2 virus and its dynamics within the population.
Further results and more details are of course available at the links provided. In them you will find discussion of all the subtleties, limitations and methods needed to unpack this big list of claims.
Lots of further, fascinating and important research is ongoing, notably in the Ferretti group and the Oxford Martin Programme on Digital Pandemic Preparedness - keep an eye out for their talks and upcoming publications.
Outlook
Why is all of this important?
First, retrospective insights into COVID-19 are valuable. It is important to understand more about how COVID-19 spread and to evaluate how effective each public health intervention was, for cost-benefit analysis and accountability.
Second, these findings have big implications for pandemic preparedness. Many lessons can be learned from reflecting on app implementations internationally and understanding why their effectiveness varied dramatically. From some countries’ experiences, it is clear that Digital Contact Tracing could play a key, low-cost role in mitigating future infectious disease outbreaks whilst simultaneously gathering valuable insights in real time. We have shown that these insights can be integrated into a public health system which rapidly evaluates and fine-tunes our understanding of the pathogen, iteratively improving the accuracy of app-based ‘risk thresholds’ and better informing the wider choices of public health and social measures. Such a system could efficiently and effectively reduce pathogen spread whilst minimising our reliance on less effective measures with more negative socio-economic impacts.
There remains a vital need to invest in Digital Public Health technologies for pandemic preparedness, so that effective, trusted interventions can be implemented from Day 1 of an outbreak.